
Building approvals data gives a picture of work 'in the pipeline' for coming months
-8.7 % m/m a big miss on estimates
- expected -3.0%, prior -1.8%
-6.4% y/y, ... ditto
- expected +2.1%, prior +10.1%
If you head on over to the Australian Bureau website, everything is just fine!
- The value of total building approved rose 2.1 per cent in September 2016, in trend terms, and has risen for 10 months
- The result was driven by a 6.0 per cent rise in the value of non-residential building, while residential building fell 0.1 per cent
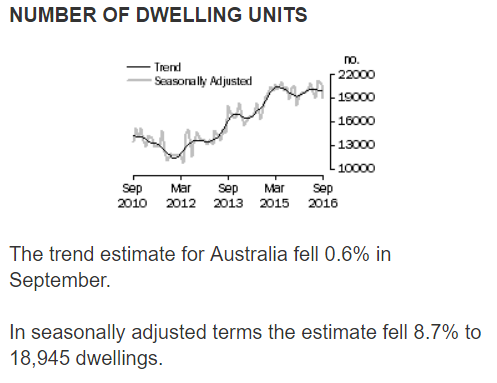
- The number of dwellings approved fell 0.6 per cent in September, in trend terms, and has fallen for four months
The ABS there focusing on the 'trend' data, and total building, not just residentialwhereas the headlines focus on the seasonally adjusted.
So, a look at residential, both s.a. and trend:
---------------------------------------------------
Having a look at the graph, its been pretty flat (trend) at a high level (since September 2010 when this graph starts.
AUD impact is muted so far, running close to session lows:

--
The 'pipeline' of new residential building is jam-packed, with a big supply of apartments coming on line very soon. This big supply should weigh on prices, the broader concern is it results in difficulties selling projects and damage to financial stability and the economy. That's the bear case on Australian housing ... let's see how it plays out!

