
There hasn't been two consecutive daily closes below the 200-day MA for the S&P 500 since January 2016
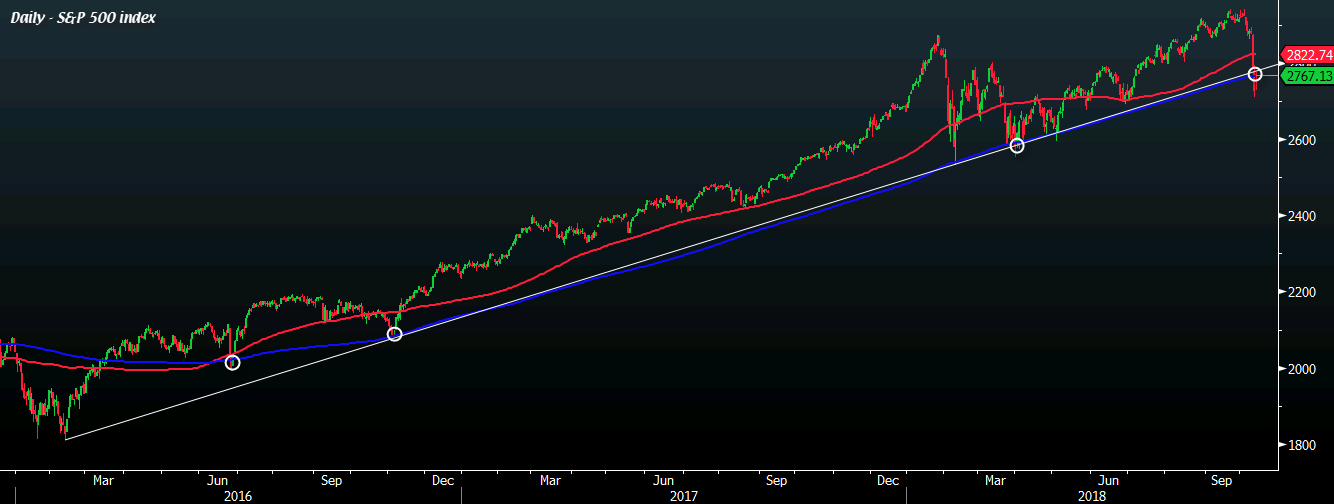
Last week was a real test of mettle for equity traders and it resulted in nervous tones across markets. Thursday marked the first time the S&P 500 closed below the 200-day MA (blue line) since early April and for good measure, Friday's close managed to find its way above that level by slightly less than a point.
Is that significant? Historically, the pattern seems to suggest so. Dating back to January 2016, price has not closed below the 200-day MA on two consecutive trading days and as a result, the bullish run in US equities has continued.
However, a significant fall back below the 200-day MA in trading this week cannot be understated. Price has broken below the mutli-year trendline supporting the upside momentum and a break below the key level will spell trouble for equities and risk sentiment moving forward.
Watch this space. This will be one of the key areas to pay attention to in markets this week.

