
It is hard to pick a top, but....
It is hard to pick a top in a US stock market that is up 4-5% in the first few months of the year.
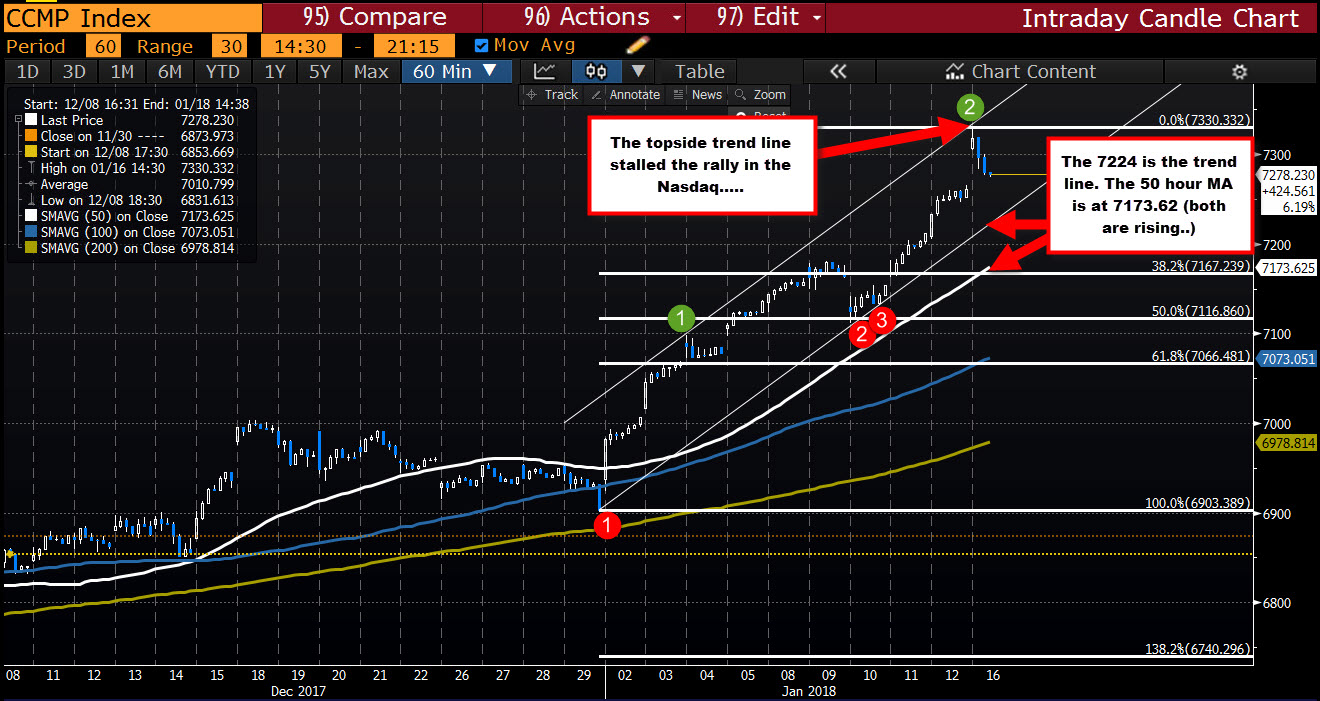
However, if you look at the hourly charts of the S&P and the Nasdaq composite index, there may be a cause for pause.
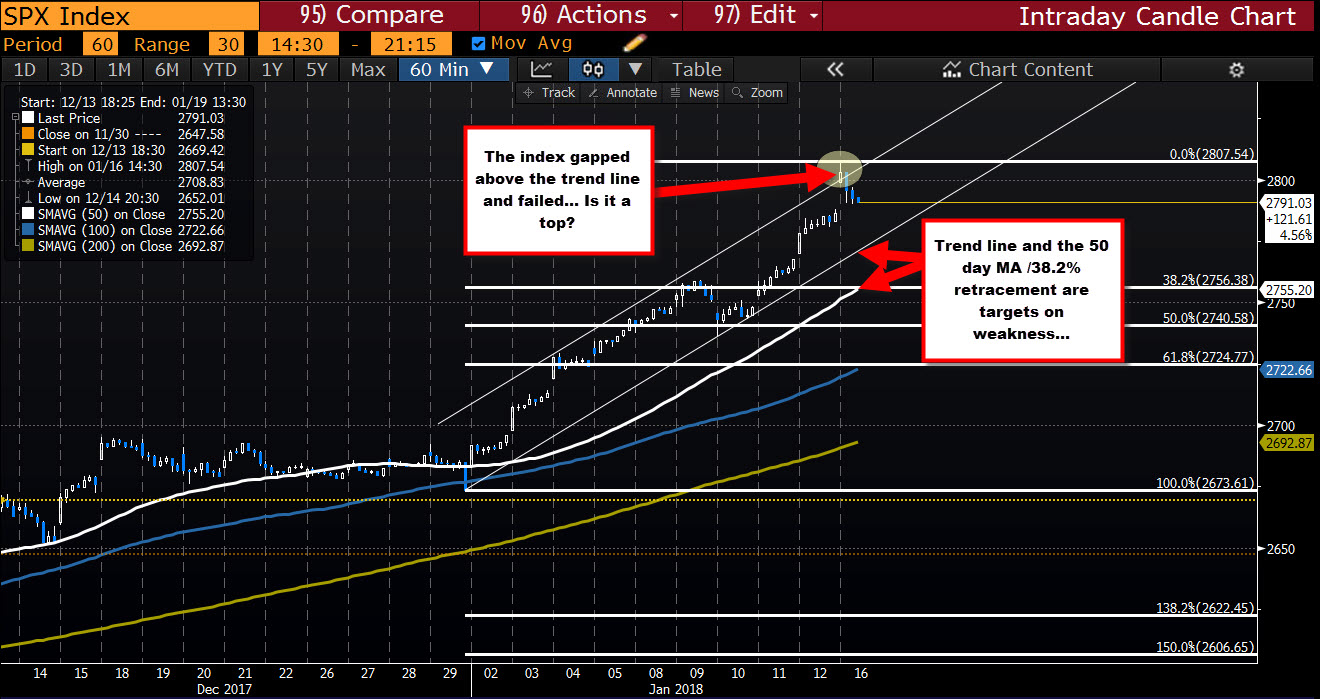
Looking at the S&P index (see chart above), the price gapped higher today and in the process also gapped above a topside channel trend line. That break higher should have led to further upside monentum. It did not. The next hourly bar closed below that broken topside line, and the price has rotated lower and is trading near day lows. A lower trend line (at 2771 and rising) and the 50 hour MA (white MA line at 2755 currently) are targets that would need to be broken to give sellers some comfort. Absent that, the buyers are still in control.
For the Nasdaq index (see chart below), the gap higher did not move above a topside trend line (see green circle 2) but instead tested that topside resistance line. The inability to get above that line, gives sellers a reason to sell/take profit, and the price has rotated lower. The lower channel trend line at 7224 currently (and rising), and the 50 hour MA (white MA line at 7173.62) are also targets that if broken to the downside, would give sellers more reasons to liquidate/take additional profits.
It is very difficult to pick a top in this rising stock market. However, if the intraday selling seen on the gap opening can continue today, and some of the lower technical levels be broken, perhaps there can be more of a correction is what has been a one-way market in 2018. Be aware. It may be time to put on some protective puts (invest some of the gains in some option protection).

