
..Buyers hold a slight bullish bias.
The USDJPY peaked for the year on January 3rd - which on my chart was the 1st trading day of of the year. The low extended to 107.312 on September 8th. The midpoint of that range comes in at 112.957 (give or take). The high price today reached 112.963 - right at that midpoint level. We are trading down toward 112.50 now, but if the midpoint is a barometer for bullish and bearish bias (or one of the biases), the pair is hanging around that bias (but a little below).
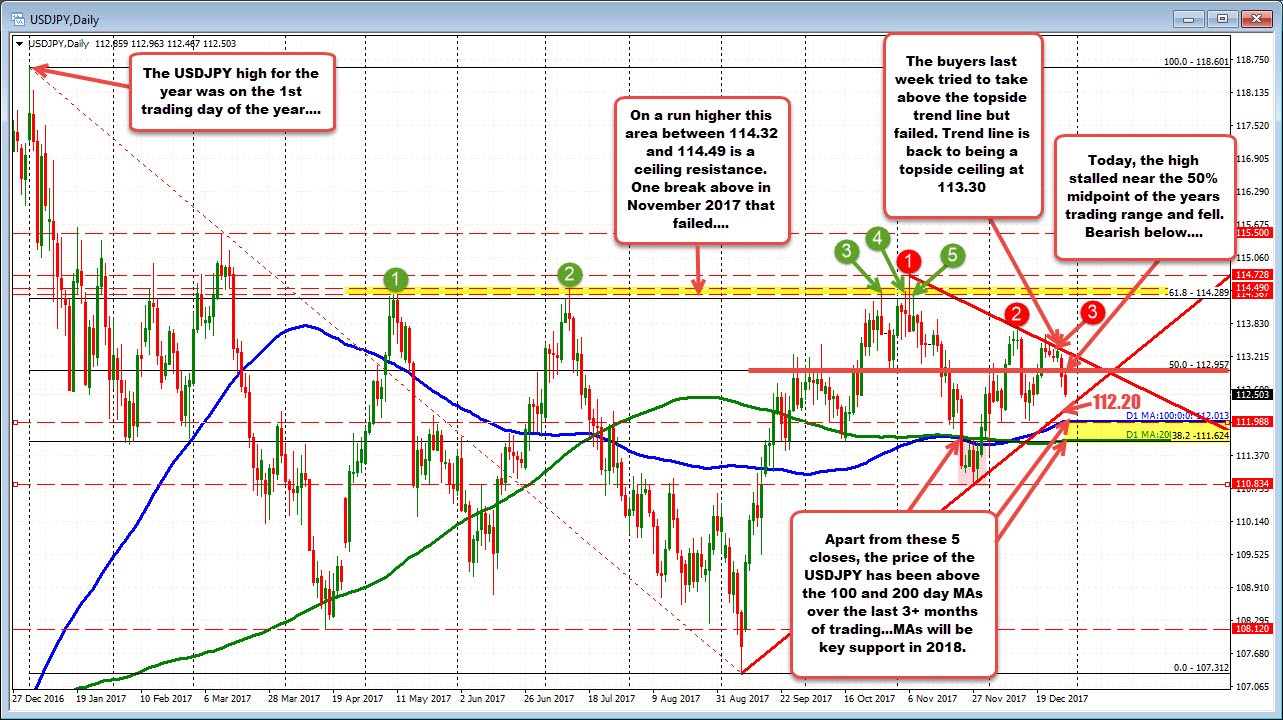
Now, drilling more closely, the pair since March has been in a more confined range with a ceiling at 114.49 and a floor around 108.12.
Now I know we traded up to 114.728, but that was a failed break in November. The price moved above and failed on the same day. The buyers failed. The sellers took back control.
We also traded to a low of 107.31 - below the 108.12 level. However, that too was only for a day.
So the midpoint of the 108.12 to 114.49 confined range comes in at 111.32. The current price is above that level (more bullish).
We are also above the 200 day MA (green line) at 111.624 and the 100 day MA (blue line) at 112.013. That too is bullish.
Going into the new year if the buyers/bulls are to keep the control, I will look for those two MAs to be the key barometer. Stay above...is more bullish. Move below... is more bearish.
PS there have only been 5 days over the last 3+ months with closes below both those MA lines (in November). The sellers had their shot. They failed.
Is the technicals all bullish?
No....
The pair in December tried to extend above a topside trend line (currently at 113.30) and failed. That has helped the pair move lower over the last few days of trading. If the buyers are to take more control early in the new year, the buyers need to get above that level.
Also, there is something about the 114.32-49 area (see green numbered circles). There were a number of swing highs (see green circles) in that area. Yes, there was that one break above in November to a high of 114.728, but that quickly failed.
For a more bullish technical picture in 2018, getting and staying above that area would be a key bullish technical clue.
SUMMARY: There is a little of something for the bulls and the bears technically as we head into 2018. The price is above the 100 and 200 day MAs at 112.01 and 111.62 respectively. Stay above in 2018 would keep the bulls in control.
However, the buyers need to get above a topside trend line at 113.30 and then the pesky 114.32-49 ceiling (and stay above) to really put the buyers in firm control.
So for the traders playbook in the new year, trade against the MAs below and hope for a break higher. IF the MAs are broken, you have to go with the bearish bias.

