
But maybe extremes make some sense technically
The technical picture for the GBPUSD is kind of sloppy.
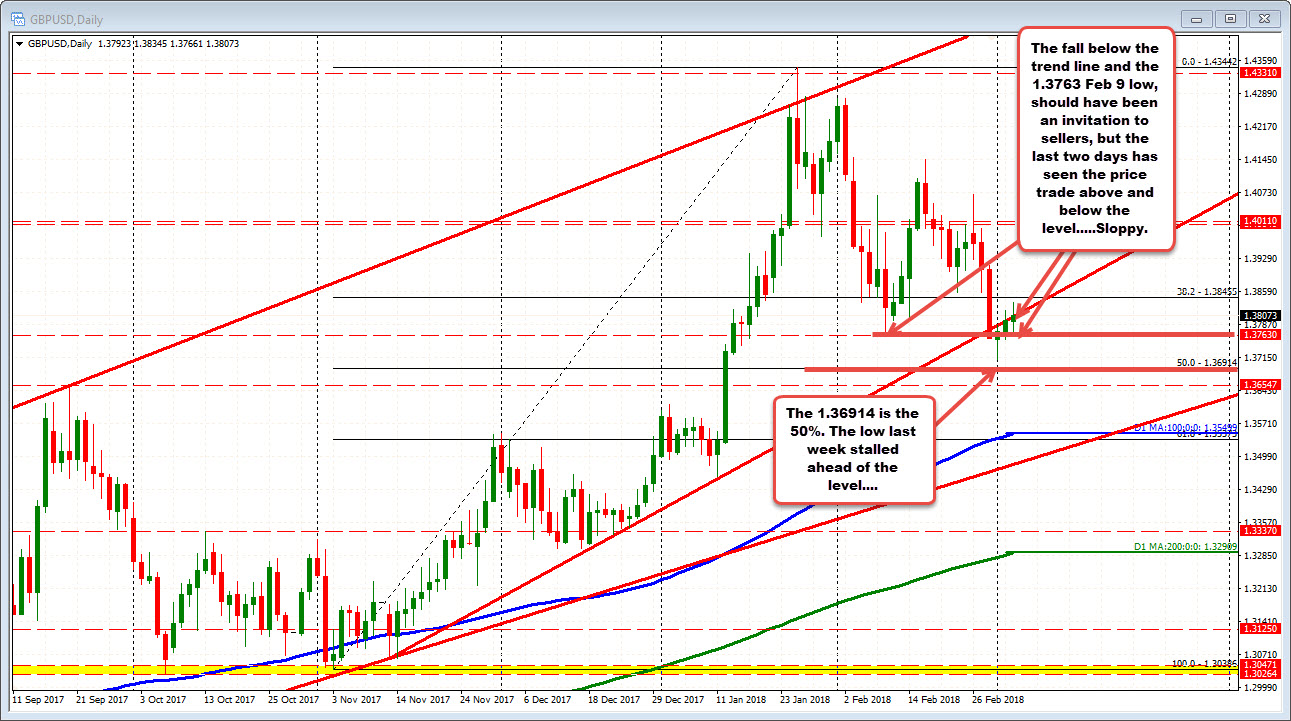
Looking at the daily chart, a trend line was broken on Wednesday last week and then extended below the swing low from February 9 at 1.3763.
The price should have stayed below that swing low and broken trend line, but by Friday and again today, the price has traded both above and below both those levels. The sellers are not exactly taking charge.
The low last week did stall ahead of the 50% of the move up from the November low at 1.36914. Overall, however, that price action is sloppy.
Drilling to the hourly chart below, the sloppiness of the technicals is also evident. The 100 hour MA today was broken and the price moved higher. However, the last 6 bars has seen the price trade above and below that MA line. The buyers are not exactly taking back control. Also today, a downward sloping trend line and upward sloping trend line were broken and each had an initial reaction and then failure. Sloppy.
What is defining the range, is the 1.38347 level above and that February 9 low at 1.3763 swing low. The 1.38347 was a swing high off a new low from February 28th. That stalled the rally today (see red circle 2).
On the downside, the low today stalled just ahead of the 1.3763 low from February 9th. The low today reached 1.3766.
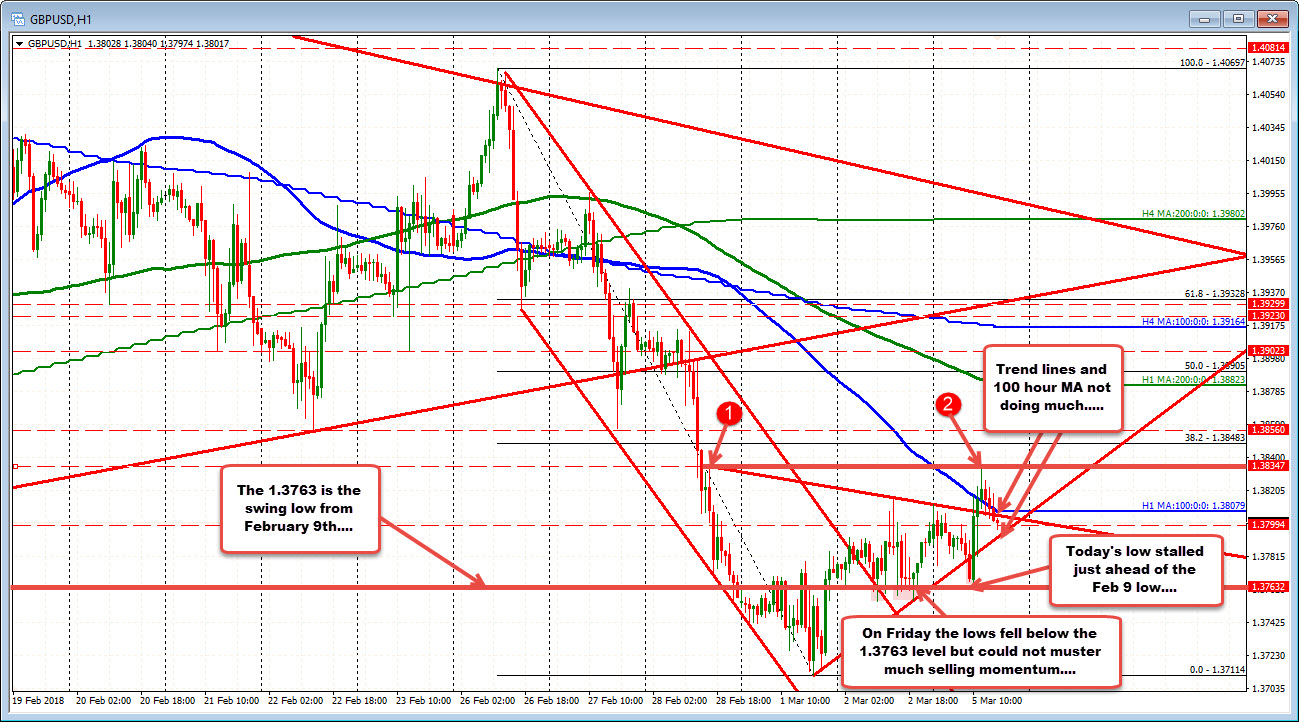
We currently trade around the 1.3800 area and around the 100 hour MA. If the sellers can keep the price below that MA line, the sellers can make another run toward the 1.3763 level (perhaps). If they can't , the level to pay attention to for the bulls is the 1.38347 highs.
Overall, however, the technical price action is sloppy.

