
Intraday ceiling being formed. Can it be broken?
It's Friday. Which means the price action can be choppy. It is also a holiday weekend in the US in honor of Martin Luther King. So activity in the US may slow in the NY afternoon.
That is a wild card, but it could mean that price action could/should follow a script.
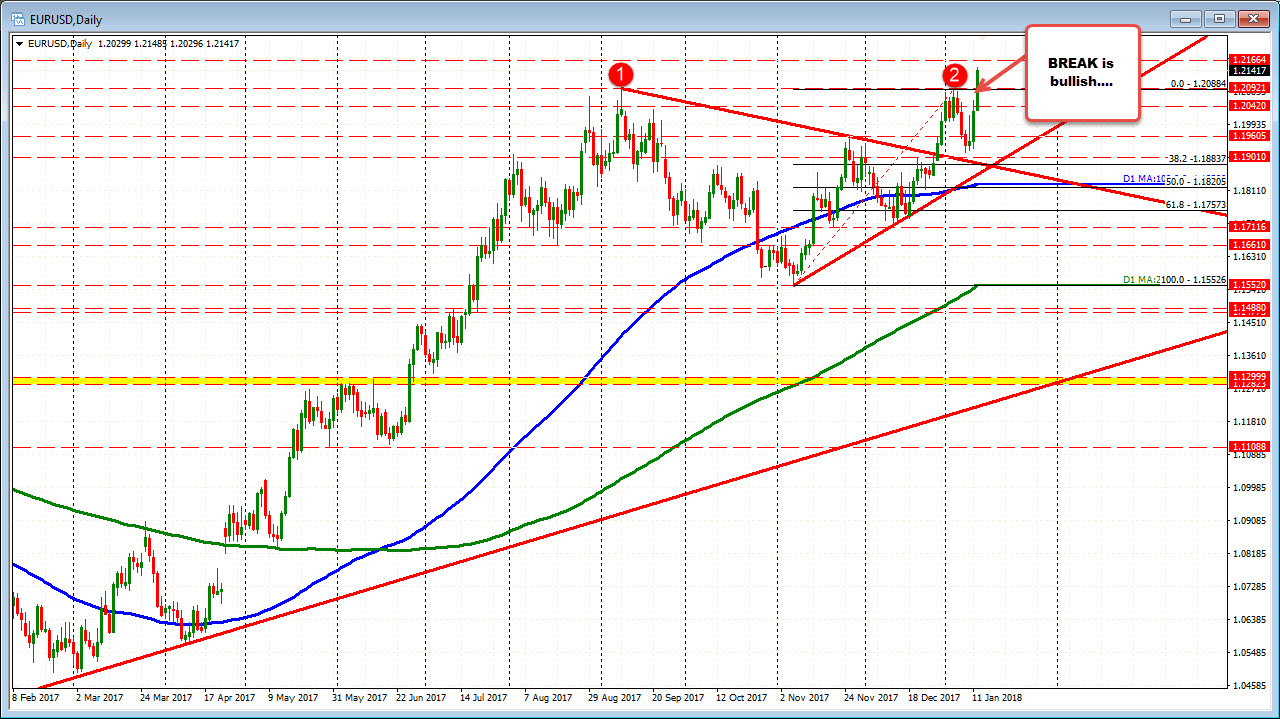
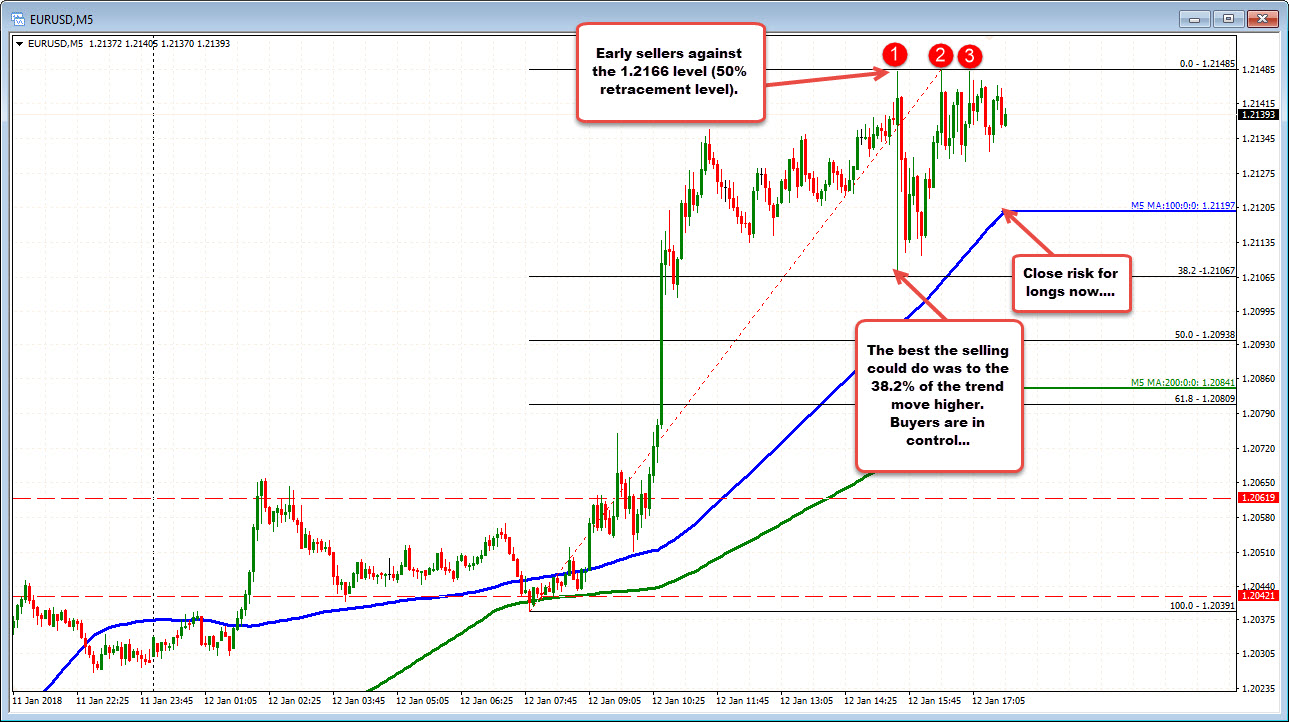
For the EURUSD the script shows a break above the 1.2088-92 area. Those were the highs from 2018 (to date) and 2017 (from September 2017). That was bullish. The price raced higher - trading up to 1.2149. That is the highest level since the Dec 31, 2014. Looking at the 5 minute chart below, there are three highs against that level. Why the stall?
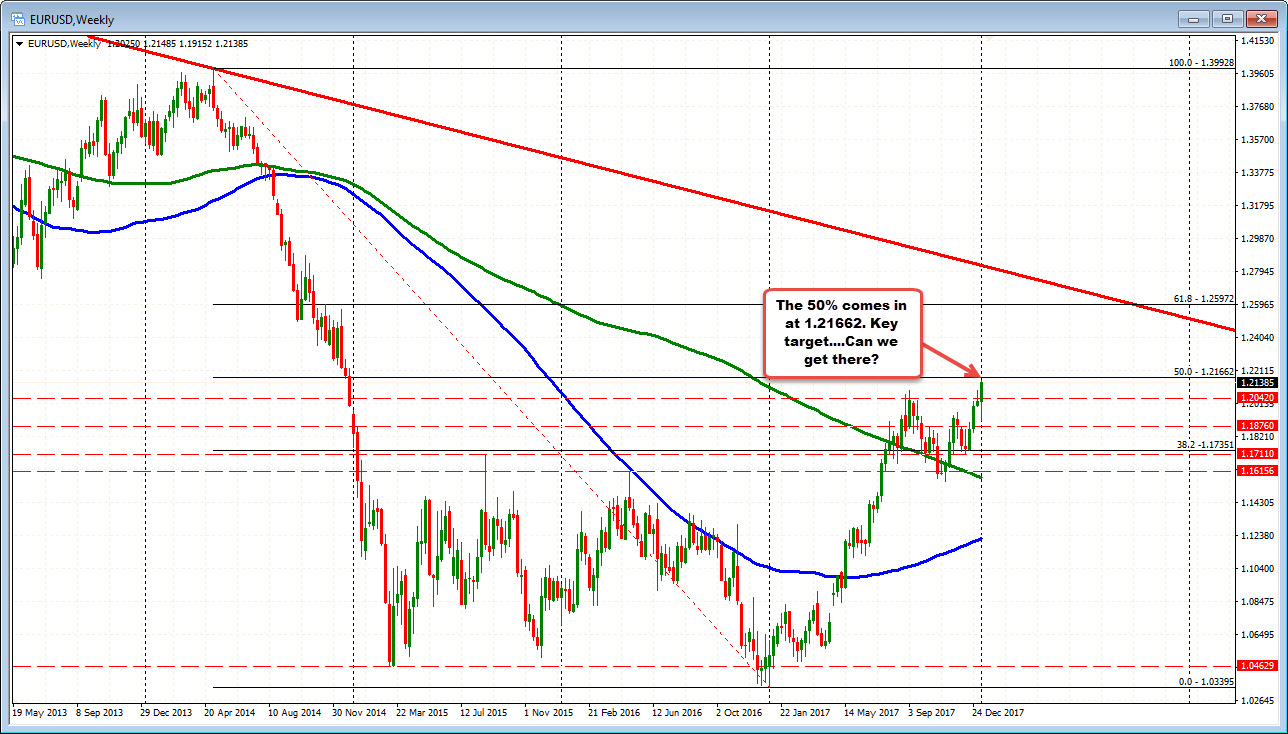
That highs - so far - are short of the 50% retracement of the move down from the 2014 high at 1.2166. That is a key component of the bullish script. The 50% tends to be a key barometer for bullish and bearish. Above is more bullish. Below is more bearish.
What else is the script saying?
Although there are early sellers/profit takers early against the 50% level, the falls have been limited to above the 38.2% retracement of the days trading range (see 5 minute chart below). That says the buyers are still in control. Sellers are not winning.
As a result, I would not be surprised to see a run-up toward the 50% level at some point because the script says so. We will see.
If the 1.2166 level is broken, that opens the door for more gains, but it should be tough on the first test - even on a Friday.
CLose risk for longs is the 100 bar MA on the 5-minute. Move below and the triple top might be of more interest for traders on a Friday.

