The 2017 September high is tested on the first trading day of the year
Traders are back at their desks, rubbing their eyes after a long New Years weekend. P/Ls have all be reset to $0. It is back to normal - or close to it (the data starts to come out tomorrow with Non Farm Payroll being the most important release at the end of the week).
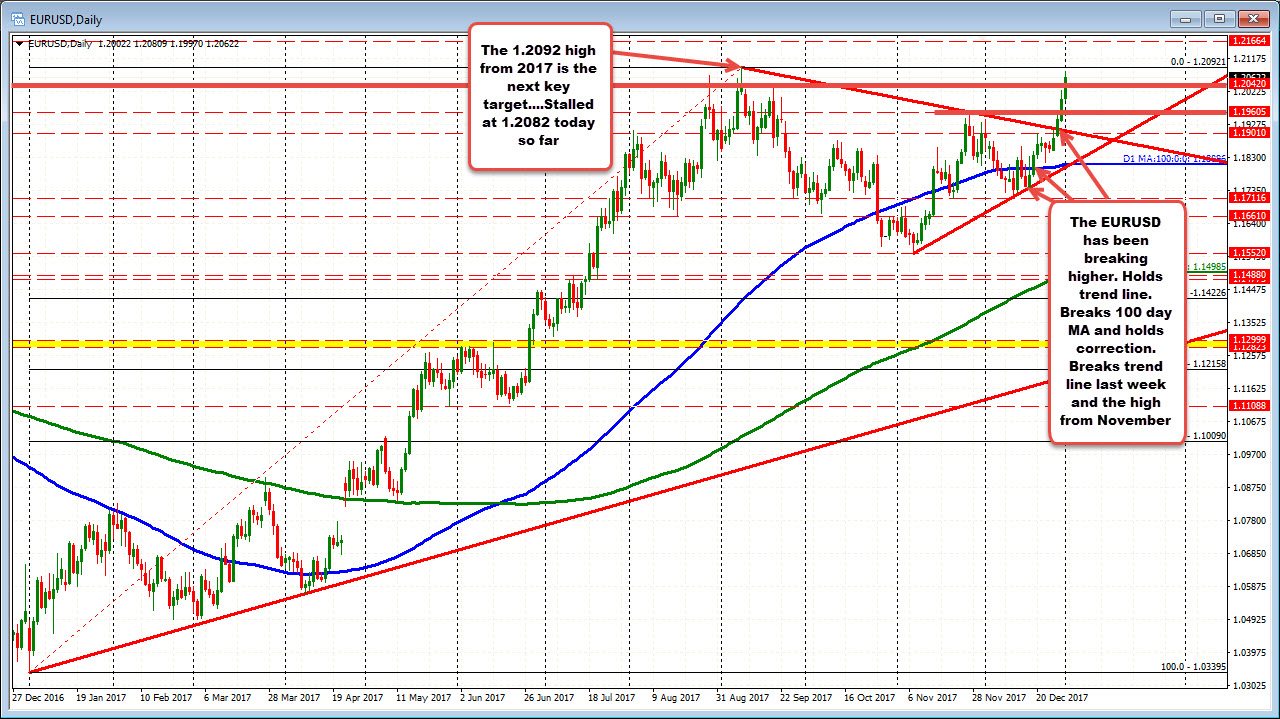
For the EURUSD, it is starting the year, where it ended - moving higher. The last three days of 2017 saw the EURUSD move higher each day. The price moved from 1.1852 to a high of 1.2025 on Friday. Today, the pair has extended that range up to 1.2081. That is close to reaching the 2017 high of 1.2092 from September 8th.
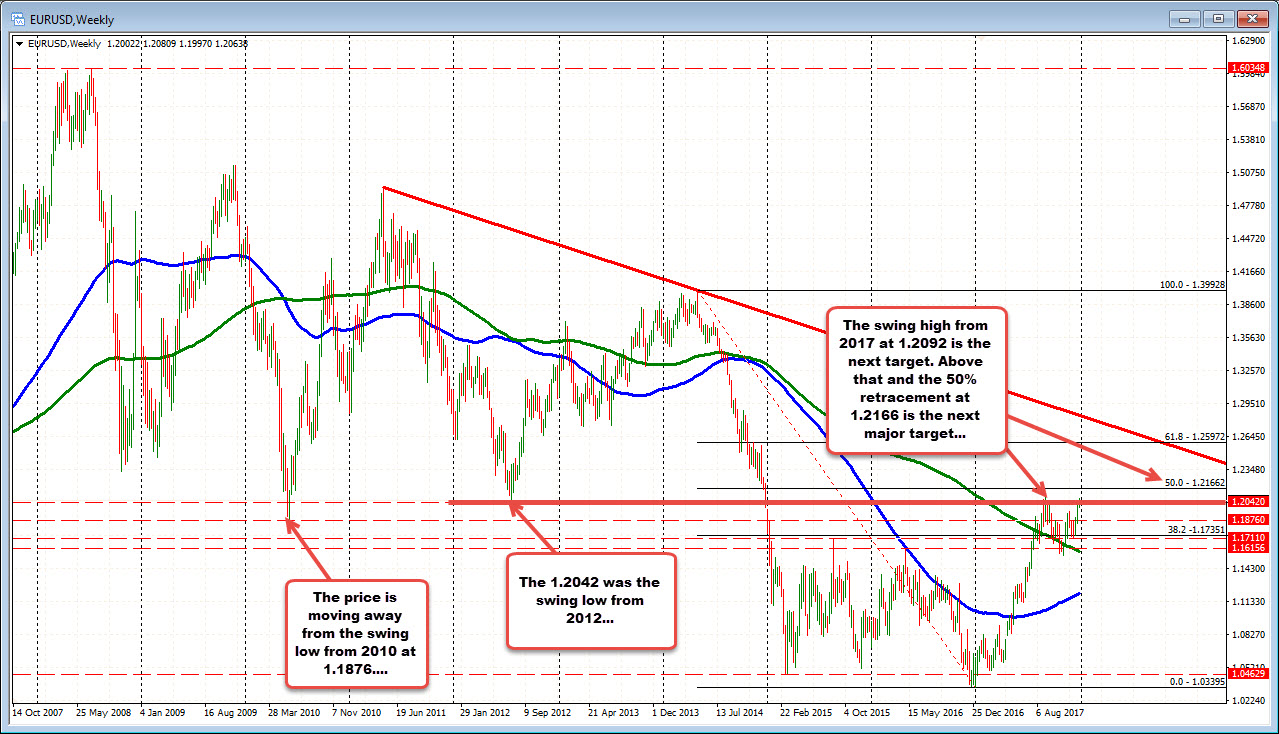
IN the process today, the price moved above the 1.2042 level. That level corresponds with the swing low from July 2012 (see weekly chart below). That is a risk level for the EURUSD today. A move below would take a little luster out of the run higher (especially if it fails to take out the 2017 high). Be aware.
A move above the 1.2092, would improve the bullish bias for the EURUSD. The pair would be trading at the highest level since the end of 2014. Looking at the weekly chart below, the 1.21662 would be the next target. That is the 50% of the move down from the 2014 high.
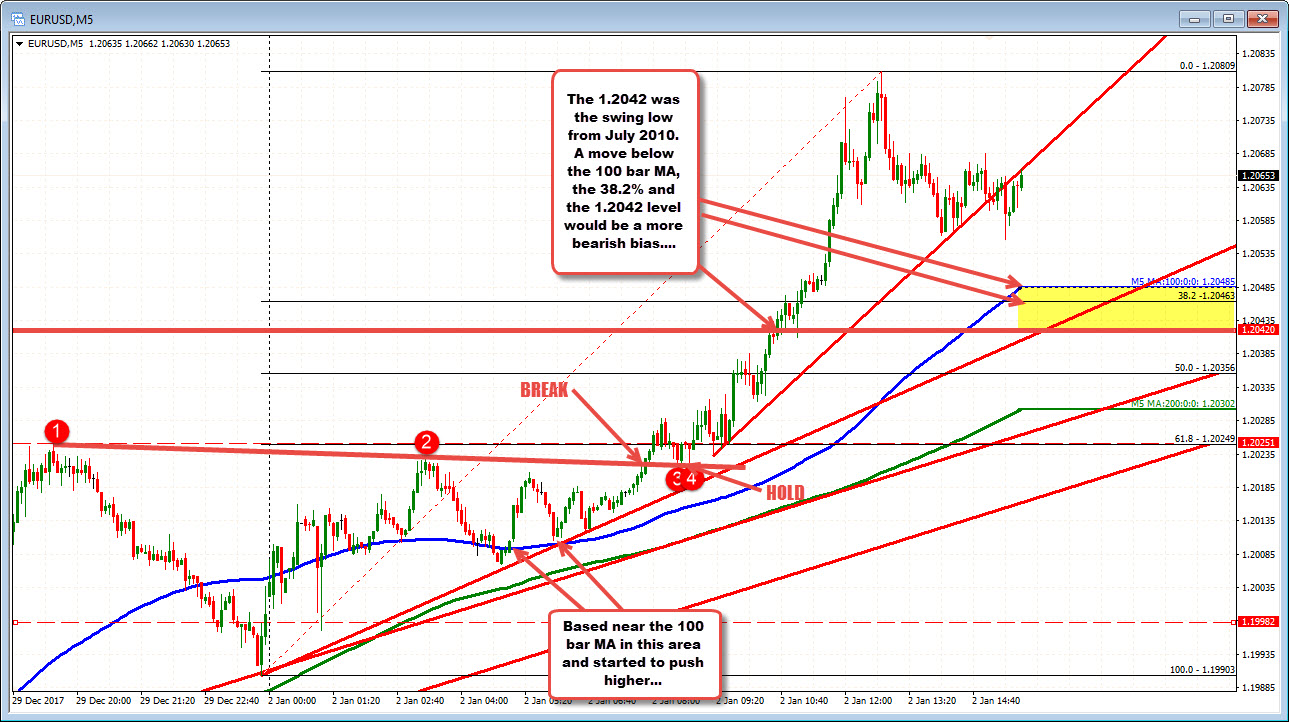
Drilling down to the 5 minute chart below, the pair based near the 100 bar MA (blue line in the chart below), and broke a topside trend line (see red numbered circles). The move above the 1.2042 level saw a stall before moving higher. The support for dip buyers is now at the 1.2042 to 1.2049 area where the 38.2% and the 100 bar MA (blue line is found). There is overhead resistance from the 2017 high at 1.2092, but if the correction can not break the 1.2042-49 area, the buyers are still in control technically.