
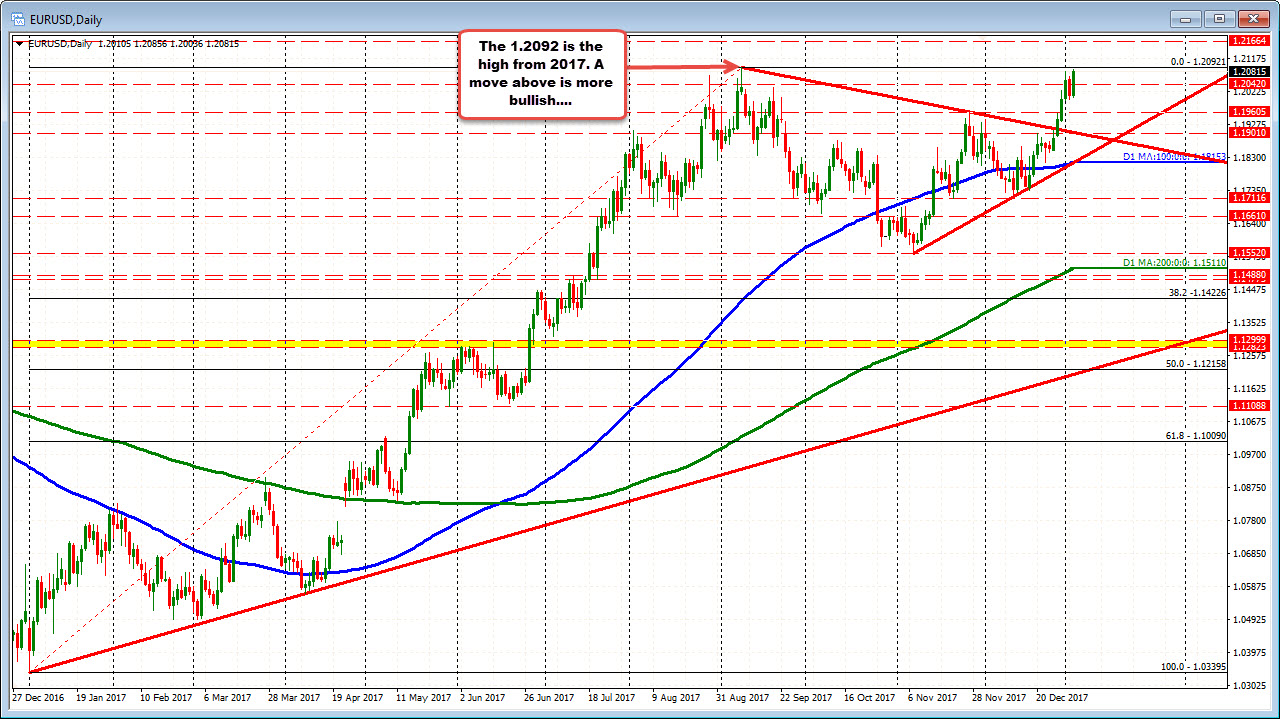
Gets close to the 2017 high price at 1.2092
The EURUSD is trading at new session highs at 1.20838. In the process, the price is approaching the high price from 2017 at 1.20921. A move opens the door for further upside momentum.
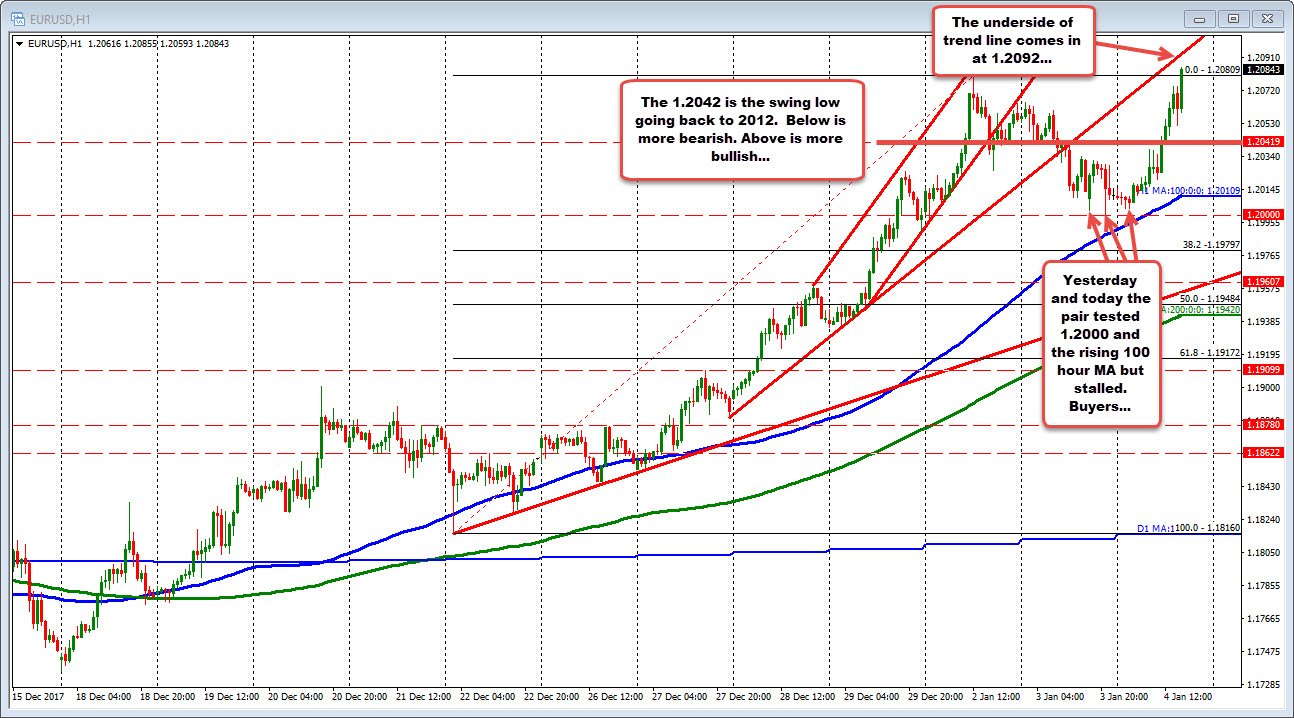
Yesterday the pair corrected but could not get below the 1.2000 level (see post from yesterday). The inability to get below that level and the move back above the 1.2042 level today (was the swing low going back to 2012), opened the door for further upside. Looking at the hourly chart below, the pair is also moving away from the 100 hour MA (blue line) after getting close to it yesterday and earlier today on the dip.
The underside of a broken trend line comes in at 1.2092 on the hourly chart. That corresponds with the high price from 2017. Key target resistance level being approached.
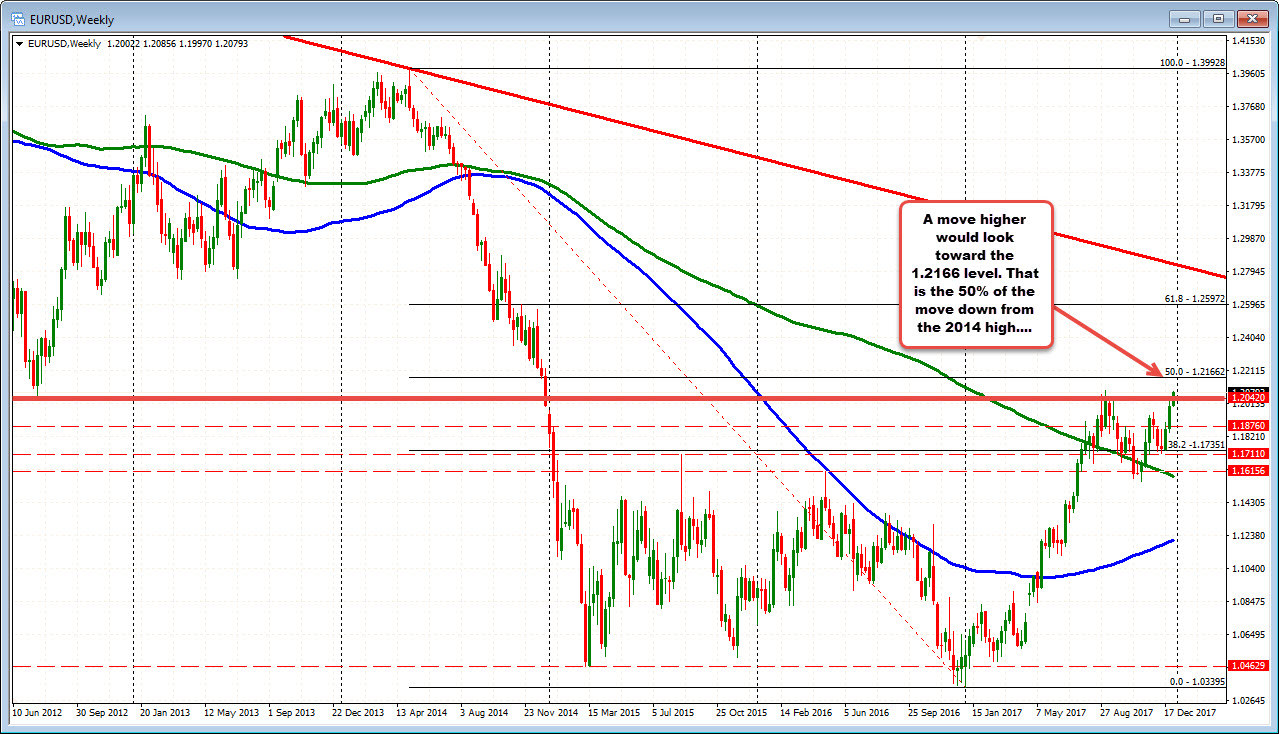
Looking at the weekly chart below, a break above the 2017 high (and the 1.2100 natural resistance level) would look toward the 1.21662 level. That is the 50% of the move down from the 2014 high.
The 1.2092 is a key level for a couple reasons. Does it hold or is it broken?

