
The pair trades at the highest level since 2009 but the trend line stalls the gains
The EURGBP is trading at the highest level since October 2009. On Friday, the price moved above the 2016 high at 0.9144. Yesterday it closed above that high and traded to a new high of 0.9162. Today the high has been extended to 0.91745. The price is breaking on the daily chart. It is breaking to a new 8 year high above 0.9144. That is now risk for the longs looking for more upside.
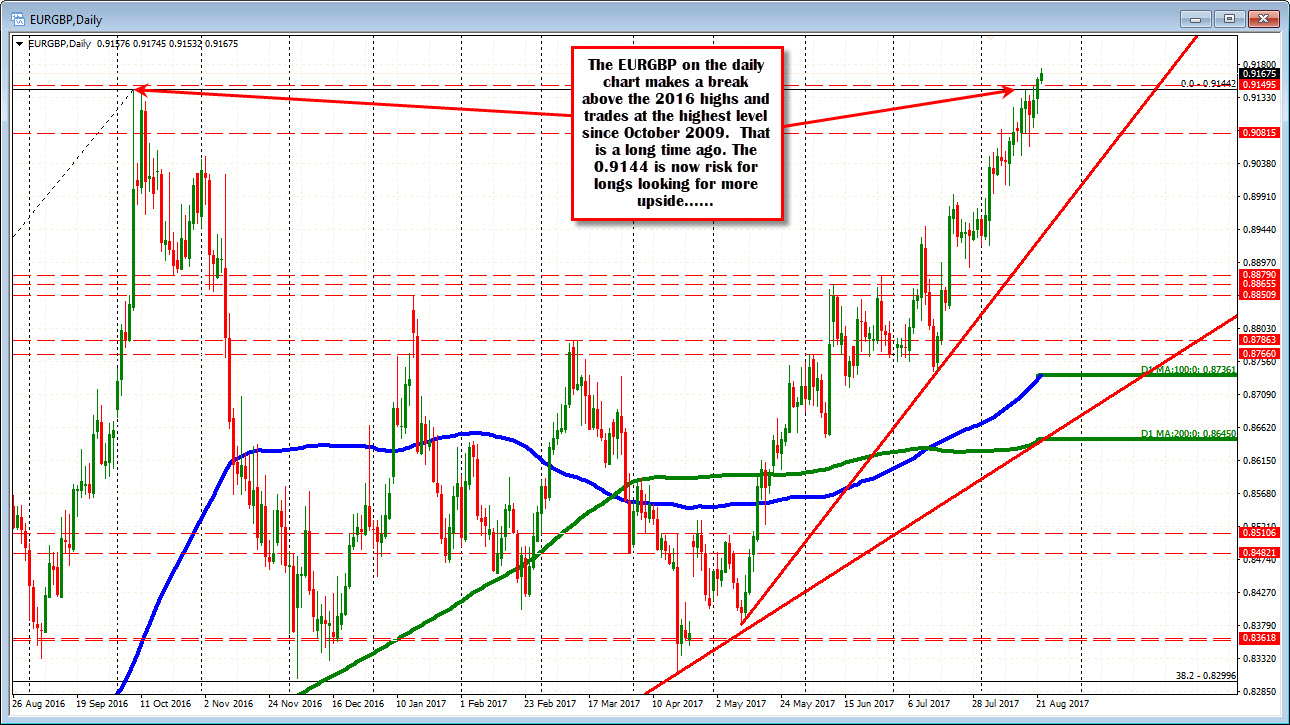
What stops the "more upside"?
If you drill to the 4-hour chart and connect recent highs with a trend line, the pair has run into the next target in trading today. That trend line cuts across currently at 0.9177 on the current 4-hour bar. The last two bars stalled against that trend line at red circle 8 and 9.
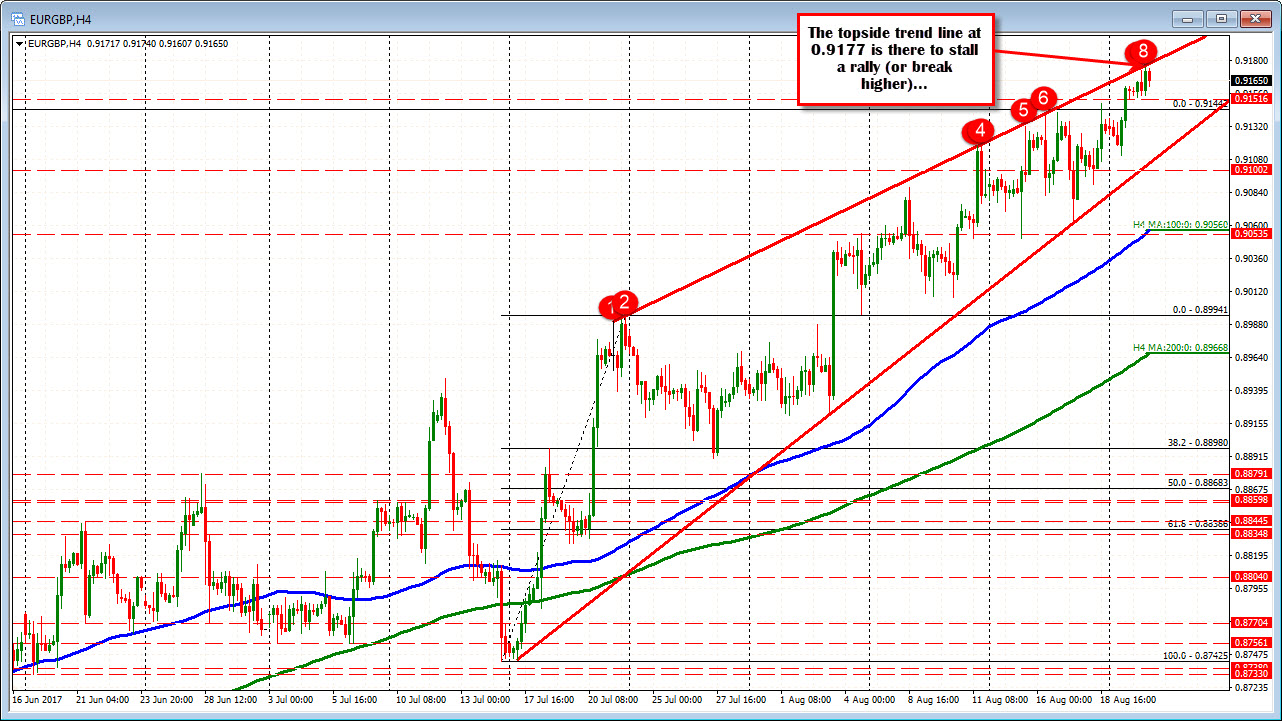
So on the daily chart, there is a break, but on the 4-hour chart, the pair has some overhead resistance that is holding the line. Profit takers/new sellers are sticking a little toe in the water to see if the bears can keep the lid on the pair.
If it holds (look for stops on a break), the key support remains below at 0.9144 - that old high on the daily. Shorts/profit takers/even buyers/longs still in it, will be looking at that level to hold on a dip. If it does, another leg higher will be expected. If it does not hold, the run up may have move corrective action to the downside left in the pair.

