
And the extremes are converging
The PPI data out of Canada were higher than expected. As a result, the price of the USDCAD has moved lower and in the process kept the price below the 100 hour MA (blue line in the chart below). That line comes in currently at 1.25404. The high reached 1.25405. Earlier today (in the Asia Pacific session) the MA was also tested and sellers pushed the price back lower. Key technical level above...
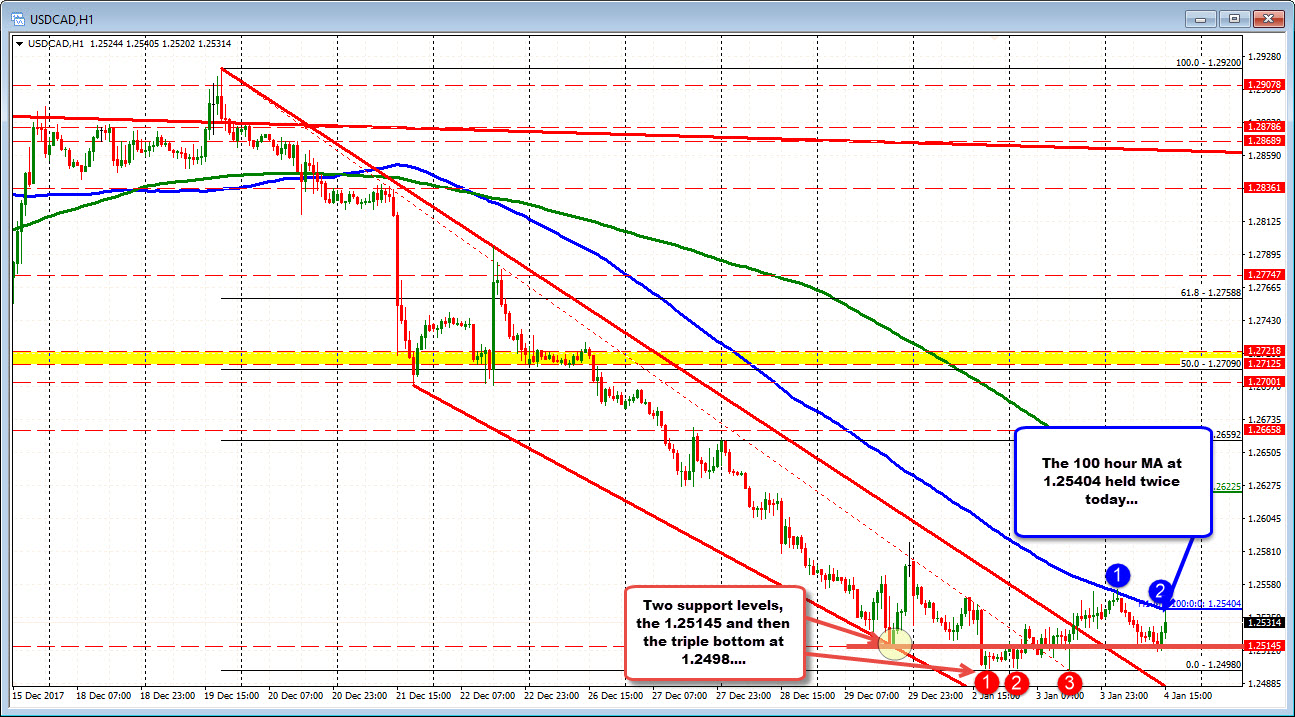
On the downside, the pair found support buyers right around the 1.2500 level on Tuesday (well 1.2498) and again yesterday (twice). The triple bottom makes for a key level below....
There is an interim level at the 1.25145 area on the downside. That was the low from Friday.
So the battle lines are set. The battle is going on with the 100 hour MA above and the triple bottom below. Look for a break and a run. The sellers (with help from the PPI data) have the advantage.
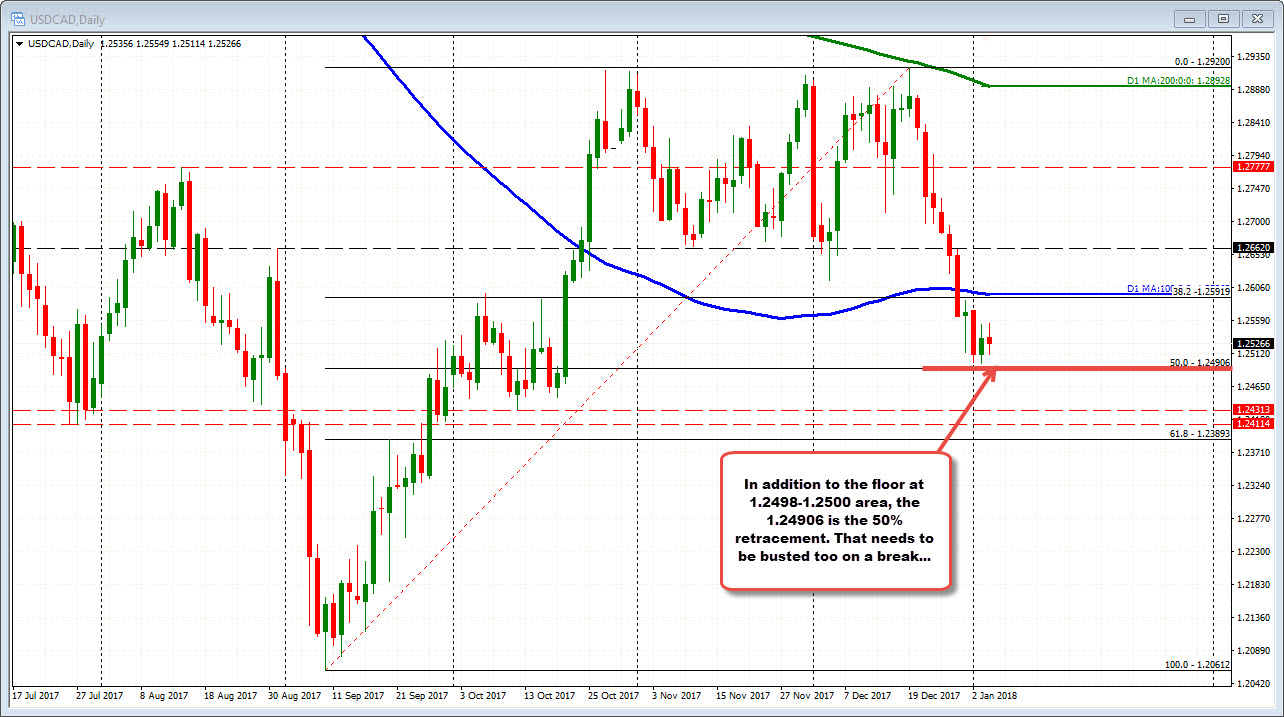
Looking at the daily chart, in addition to the floor at the 1.2498 area, the 50% of the move up from the September low comes in at 1.24906. A move below that level will also be eyed from a technical perspective (be aware of that hurdle).
PS oil prices remain supportive with the price of crude oil up $0.10 at $61.72.

