
Retail sales and RBA decision in the new trading day
The new trading day will not only bring some economic data out of Australia, and the RBA decision.
The RBA decision will be at 10:30 PM ET/0330 GMT with the expectations of no change. Eamonn posted a preview of the expectations HERE. On the negative side is the underwhelming wage data. On the positive side is the optimism of stronger GDP growth in 2018. GDP will be released on Wednesday in Australia.
Before the data (7:30 PM ET/0030 GMT, retail sales will be released with expectations of a 0.4% gain for January. That comes after a -0.5% fall in December. The YoY is expected to rise by 2.6%. You can read a preview HERE.
Finally, the current account data will also be released at 7:30 PM ET/0030 GMT. The preview can be found HERE.
Those are the fundamentals that will shape the trading.
What are the technicals saying?
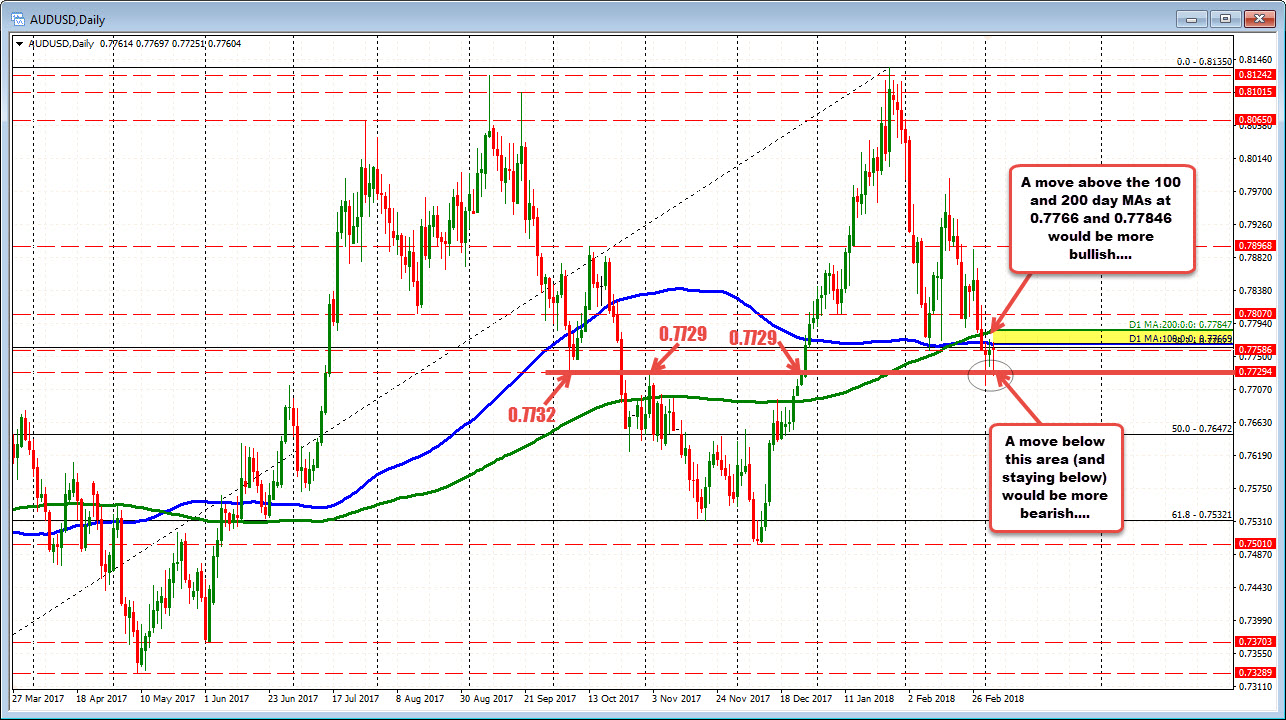
Looking at the daily chart above, the pair is trading just under the 100 day MA at 0.77669 (blue line in the chart above). That MA was broken on the Wednesday last week, and for the most part traded below since. The 38.2% of the move up from the December 22, 2016 swing low comes in at 0.7766.
Above the 100 day MA and 38.2% is the 200 day MA (green line in the chart above). That MA comes in at a little higher at 0.77847.
If the bias from the events are more bullish, breaks of those levels will pave the way for more upside potential.
On the downside, the close target is comes in at 0.7729-32. Swing levels from October, November and December 2017 came in at that area. In December that level was broken, and has not been revisited until last week. On Thursday, the level was broken but rebounded. Today, the price too a little peek below the level (the low reached 0.77251), but rebounded back higher.
If the price is continue to recent trend to the downside, that area at 0.7729-32 would need to be broken and remain broken.
The trading of the events will be volatile and time separates the economic releases from the central bank decision. Moreover the levels are fairly close together.
However, the levels can be used as barometers for bullish and bearish bias. Move above the 100 and 200 day MAs is move bullish. Move below the 0.7729-32 is more bearish. Of course on either break, those levels will then become risk levels for trades. You will want to see a break with momentum, and those breaks to then define the stops for the trade.

