Forex new for traders on July 20, 2017.
- Nasdaq up for the 10th day in a row, and new record but just barely
- Forex technical analysis: USDJPY can't stay below the MAs
- Look for further AUD/JPY gains - Credit Agricole
- OJ Simpson granted parole
- Crude oil futures settle at $46.79/BBL
- OJ futures looking good or bad, depending on your perspective
- Bill Gross: It won't take an inverted yield curve to kick off a recession
- US sells 10-year TIPS at 0.489%
- It's the New Zealand dollar's turn to beat up the dollar punching bag
- AUD/USD on the uptrend but it might have gone too far, too fast - Citi
- Are we already at the stage where Republicans blame each other?
- Euro major stock indices mixed on the day
- US dollar drops: Muller said to expand probe into Trump business transactions
- July advance eurozone consumer confidence -1.7 vs -1.2 expected
- Draghi is losing the battle to hold down the euro
- South Africa cuts rates to 6.75% from 7.00%
- Draghi Q&A: We were unanimous in no changes to forward guidance
- Draghi: Incoming information confirms strengthening of economy that has been broadening
- July Philly Fed 19.5 vs 23.0 expected
- US initial jobless claims for July 15th week 233K vs 245K estimate
- The strongest and weakest currencies as NA traders enter for the day
- At some point Draghi will get tired of the pussyfooting
- ECB leaves key rate and QE on hold
A snapshot of other markets shows:
- Spot gold up $2.69 or 0.23% to $1244.01
- WTI crude settled the July contract at $46.79 down -$0.33 or -0.70%
- US stocks were little changed but Nasdaq up for the 10th straight day and at a new record. Nasdaq up 4.692 point or 0.08%. S&P down -0.38 points or -0.02%. Dow down -28.97 points or -0.13%
- US yields are ending lower on the day: 2 year 1.3480%, -1 bp. 5 year 1.812%, down -1.1 bp. 10 year 2.253%, -1.6 bp. 30 year 2.823%, down 2.8 bps
Before US traders entered for the day, the UK retail sales came in better than expected but GBP still went down. That currency was the weakest of the day. We knew coming into the day, however, that the ECB decision and subsequent presser from Draghi would be the focus. The devil was going to be in the details (first the statement, and later in what Draghi said at the presser).
Well, the initial headlines sounded more dovish than the market expected (QE to run to the end of December and perhaps beyond and that the ECB would increase QE if they had to. The EURUSD moved to session lows at 1.1478 - still comfortable above the 1.1465 support level but below it's 100 hour MA at 1.1502.
Later when the prepared text and press conference started, the marketed could read through the spoofing the ECB president was trying to get away with. He still bemoaned inflation, but spoke positively about employment, domestic demand, broad based growth, momentum increasing chances of stronger upswing. Whether it was what he said, or what "the market: wanted to hear, or is it simply there are buyers out there that want to continue to push the market higher.
The EURUSD went up because buyers overwhelmed the sellers. Technically, the price:
- Did not threaten the 1.1465 at the lows (the low bottomed at 1.1478)
- The price moved back above 1.1500
- The price moved above the high for the year at 1.15826
- The price moved above the high from 2016 at 1.6156
- The price peaked at 1.1657.
After peaking, the rest of the day saw the price consolidate between 1.1617 and 1.1637-44. Of note is that the high from 2016 was at 1.16156. The low correction was 1.1617 - a pip ahead of that old high. Be aware of the level.
We head into the new day with the price at 1.1630. Close support comes in at 1.1615. Other support comes in at 1.1600 and 1.15826. If in the new day, the price moves below the 1.15826, I think the buyers from most of the NY day, would give up. There may be traders getting out below 1.1615 and 1.1600, but below 1.1582, would likely see more selling. It will eventually find a bottom (100 hour MA?). If support does hold, the upside momentum can continue to the 1.1711 high from August 2015, the 38.2% of the move down from May high at 1.1735 or the 200 week MA at 1.1803.
I have been talking about the cluster of technical levels defined by the 200 day MA, the 100 day MA, the 200 bar MA on the 4-hour chart and the 50% of the move up from the June 2017 swing low. All those came between 111.64 and 111.88. For the 2nd day in a row, the price of the USDJPY moved below that key cluster, and for the 2nd day in a row, the move failed. What the _____________! Today's low even took out yesterday's low at 111.545 (low reached 111.477). It did not matter. That is a bit worrisome for more downside. I would be looking to buy near the 100 day MA at around 111.75ish with a stop below the 50% at 111.64 area just because it had two shots to go lower and did not.
As mentioned the GBPUSD was lower coming into the NY session, and bottomed at the 61.8% of the move up from the July 12th low at 1.2931. The corrective move higher took the price to 1.2998 - just short of the 1.3000 level. The low from Tuesday came in at 1.3005. That area may be a ceiling in the new day. Stay below and we work toward 1.2900 -1.2920 area (trend line on hourly chart off the June 21 low) and 38.2% of the move up from June 21 low. A move below that, and the pair may be on its way to retest the month lows at 1.2812.
The USDCAD remains below it's 100 hour MA at 1.26317 (it tested the MA at the day's highs today but stalled). The price made a new low going back to May 2016. The May 2016 low was a key swing level (started the move up to the May 2017 high). It comes in at at 1.2460. I would expect buyers to show up at the level on the first test.
The AUDUSD is getting closer and closer to the 200 week MA at 0.8013. The high reached 0.7988 today. Is may be too simple, but aren't we going to 0.8013? A corrective move and base at 0.7910 might come first.
Have a great/safe weekend to those in the far east.
---------------------------------------------------------------------
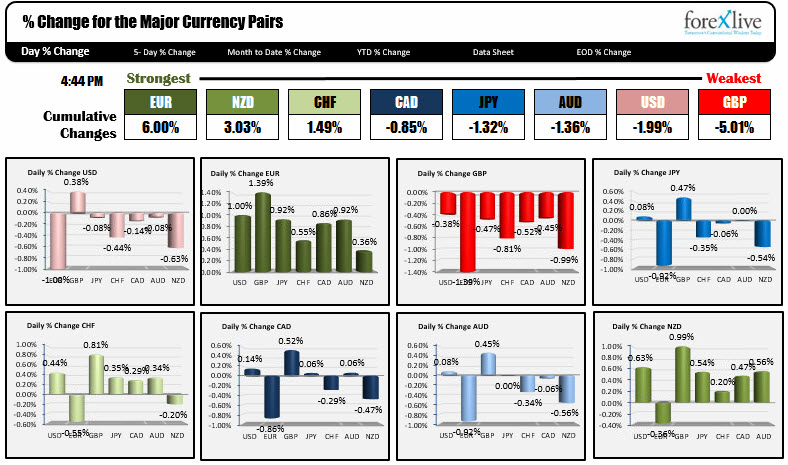
Below is an end of day snapshot of the %changes of the major pairs vs each other.
The EUR is the strongest, while the GBP is the weakest....