Cable breaks the Brexit lows but survives a test of 1.3100
The quid is looking awfully dodgy once again and has shed over 200 pips since yesterday's highs. I've marked 1.30-1.35 as my range to watch and we could be getting a look at the lower end sooner rather than later.
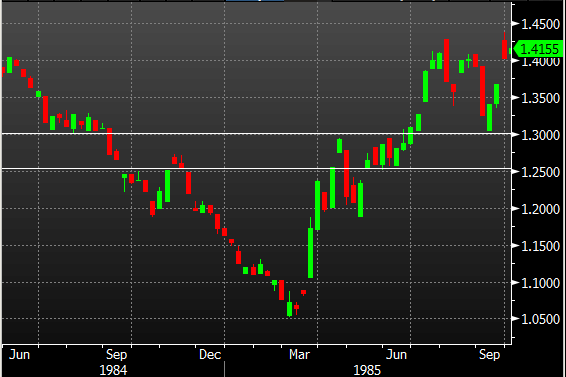
There's really not a lot on the tech front until we get to the mid-1.30's. We haven't ben there since the 1980's and here's a snapshot of that period and the reason I'm watching it.

GBPUSD weekly chart
Because I'm looking at the long-term charts I'm not picking one level to watch but the whole area. That runs from around 1.3060 down to 1.2950/1.2900. It's where the price as found either support or resistance for a lengthy period of time. In this case it was support mid-1984, and resistance mid-1985.
Break there and we're on our way to the 1.25's.
A lot of broker platforms don't go so far back so it's going to be hard for traders to grasp the technical when we haven't been at these levels for many years. If that applies to you I'd suggest looking around for other charting packages that will give you better historical data.
I believe the live charts we provide have that historical data.
For now, 1.3100 is the support and 1.3140, 1.3160, 1.3180 and 1.3200 are the main resistance points.


