Pair continues to chop
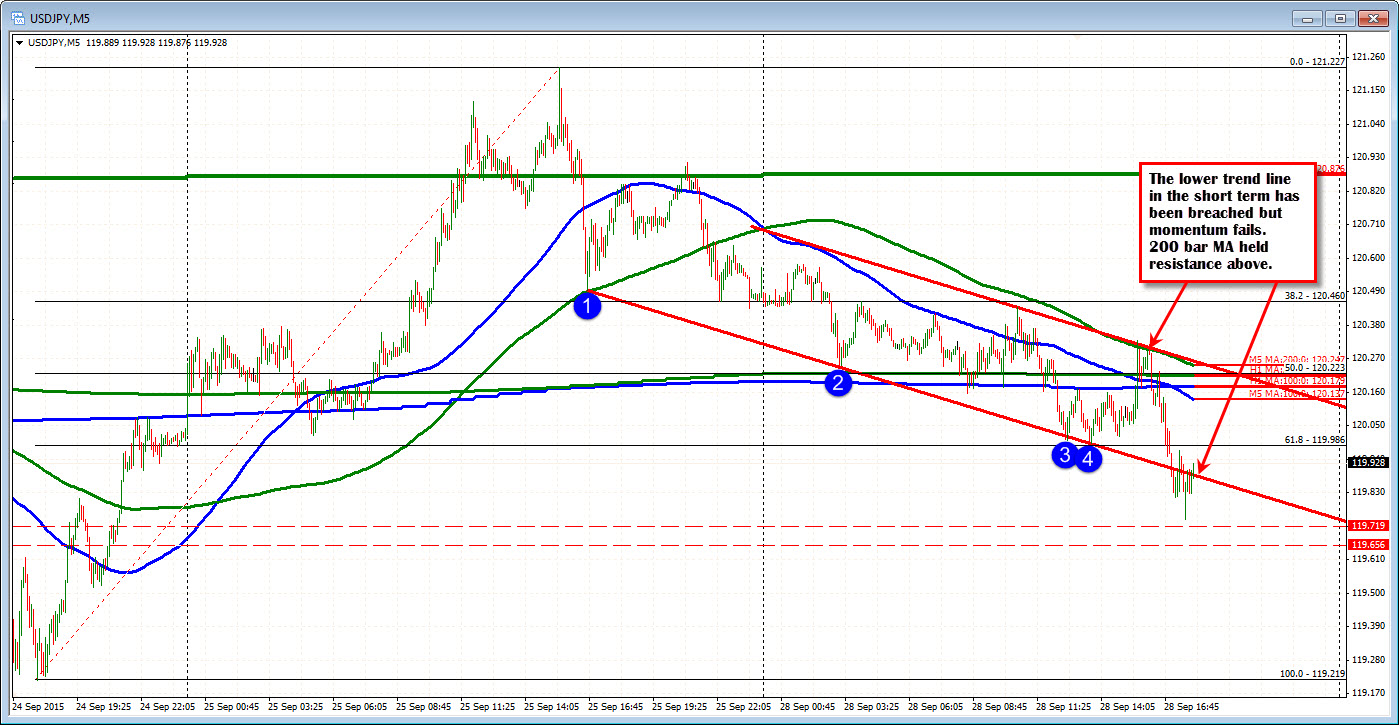
The USDJPY trades at session lows after US pending home sales fail to impress (-1.4% vs +0.4% estimate). The price moved from the 200 bar MA on the 5 minute chart (green line in the chart below) in the NY session to, and through the earlier day low at the 119.98 and a lower trend line on the same chart at 119.88.
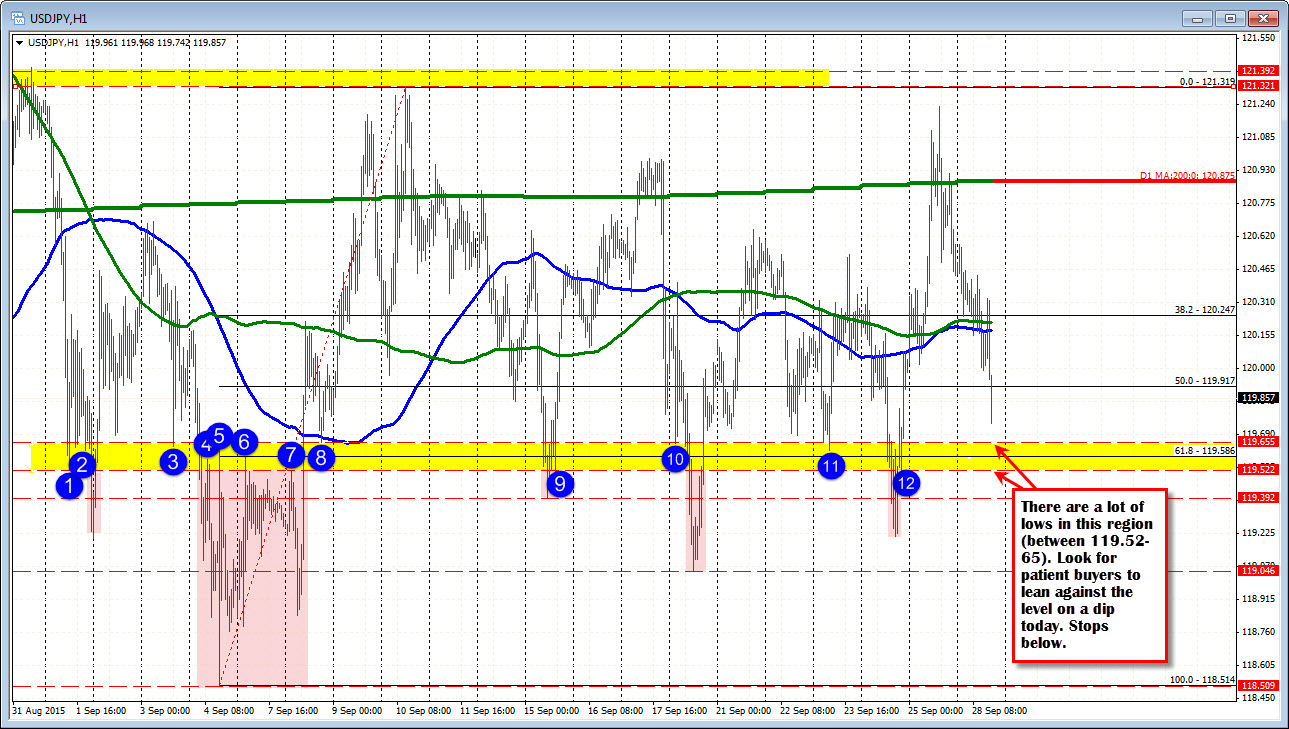
The lowest closing price since September 9 has been 119.92 (on September 18). During that time there have been 6 up days and 6 down days. The midpoint of the month? 119.917. The 100 and 200 hour MAs are up at the 120.19 and 120.21 levels respectively. Being below is bearish. It represents risk for shorts. Has the moving averages been a meaningful borderline? At times but in a market where the price is non trending, the MAs lose influence and extremes, failed breaks, become more the focus (see yellow lower area and red failed extensions in the chart below)
Looking at the hourly chart - it is all over the place of course. The 119.52-65 has had a number of swing lows and highs (an extreme lower area). Earlier in the month the price spent a few days below that level and since that time has seen three separate shorter periods with time spent below (see red areas in the chart below). Look for patient buyers to lean against the area with stops below it (yellow area).