
What levels are key through the FOMC decision
The USDJPY has settled between the 100 hour and 200 hour moving average has a FOMC statement is awaited.
- The 100 hour moving average comes in at 120.72.
- The 200 hour MA comes in at 120.167.
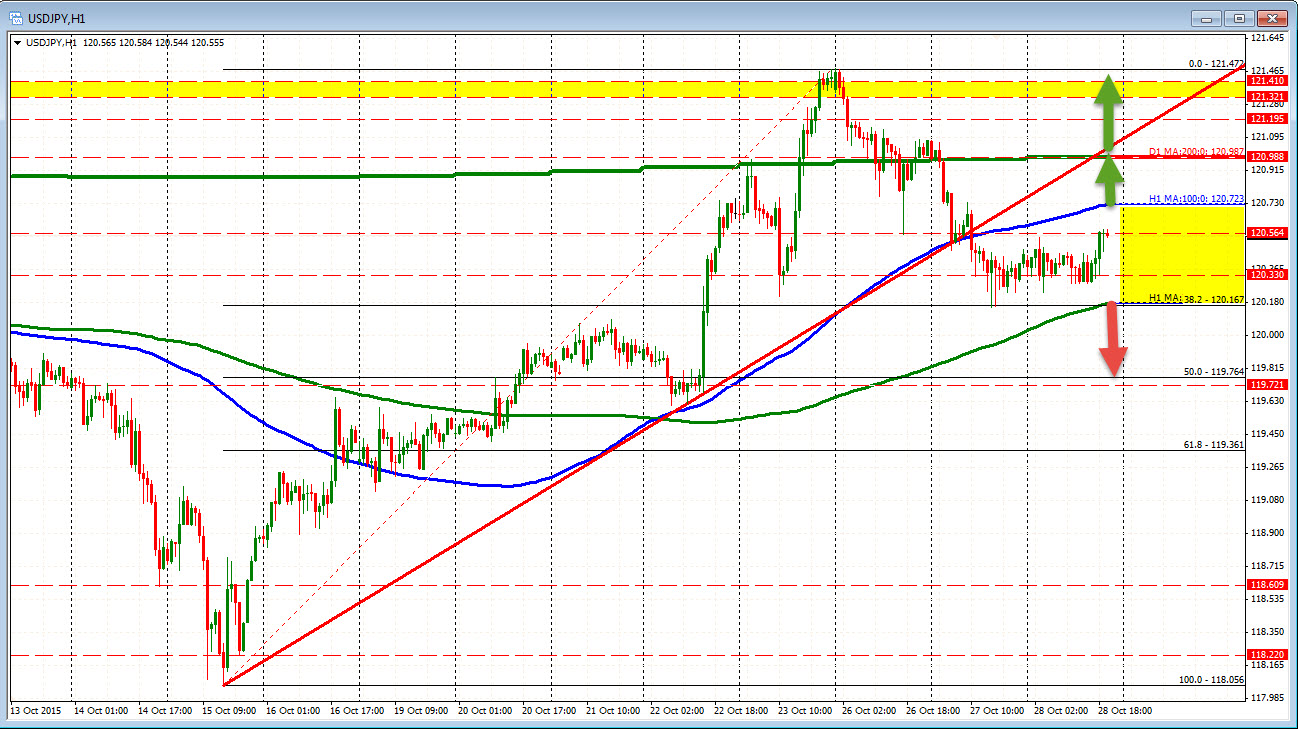
These levels will be the first target to get through on a bullish or bearish statement. What would causes a bullish or bearish break?
Bulllish: The Fed gives in to the idea that rates are at emergency levels and that the state of the economy is not in an emergency situation. They view the rebound in the stock markets as being proof that global concerns are under control. This is a window to start what they have been saying they would do.
Bearish: The Fed admits they were wrong and says that they are not going to liftoff in 2015. They cite global concerns, low inflation trends.
If the Fed keeps the idea that they are continuing to monitor data for liftoff, I would expect and up and down volatility bar fight.
What other levels are in play?
Bullish:
- 120.987 - 200 day MA
- 121.47 - High from Friday
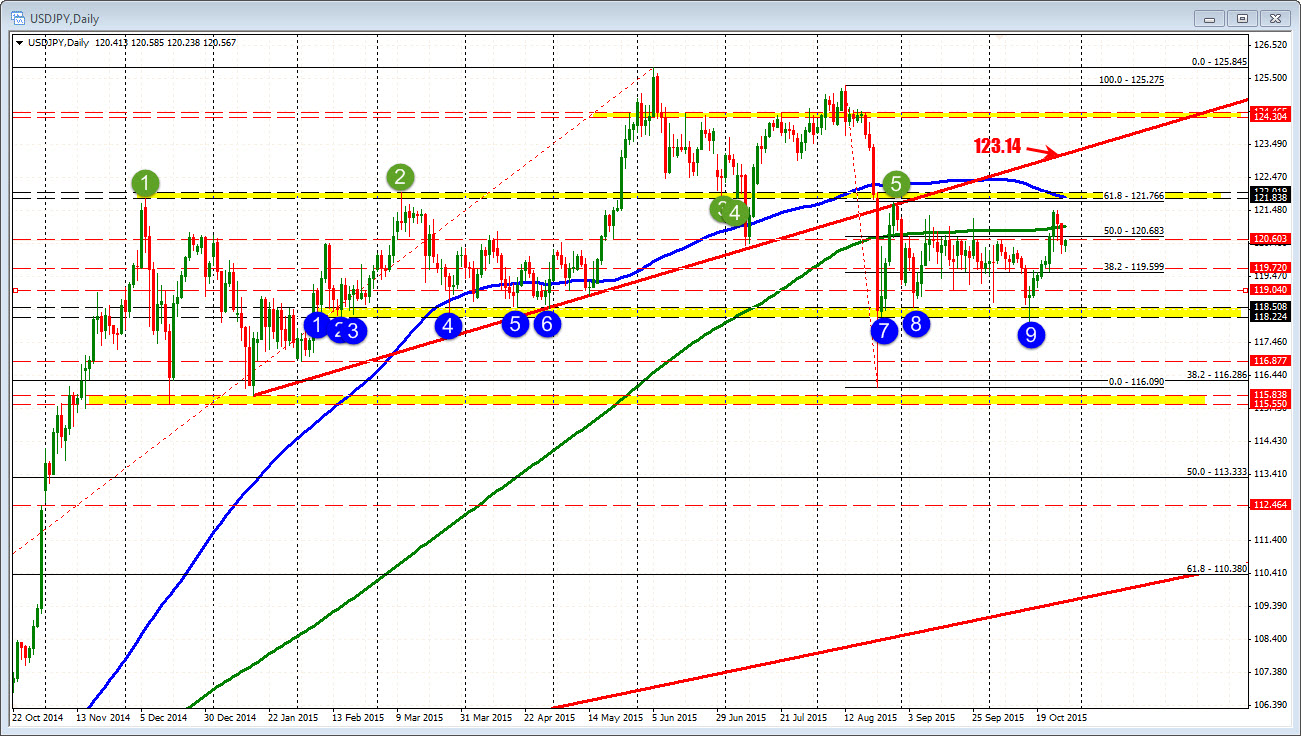
- 121.88 - 100 day MA.
- 121-84-122.02: Highs from Dec 2014 and March 2015 (and other levels since - see daily chart).
- 123.14: Underside of trend line on daily
Bearish:
- 120.167: 200 hour MA
- 119.72. Low close during month long consolidation from Sept 8 to Oct 14
- 119.04 low from Sept 18
- 118.508: Low from Sept 4
- 118.22-118.508 The range has a bunch of lows going back to February.
The levels are set. The question now is "Will the Fed surprise?" We will see.

