Trend move lower in consolidation phase
The chart below shows the trend progression of the USDJPY in trading today, followed by what has been a consolidation phase at the lows. With overlays of the key MAs like the 200 day MA, the 200 and 100 hour MAs, the downward trend progressed orderly but with a definitive bearish bias.
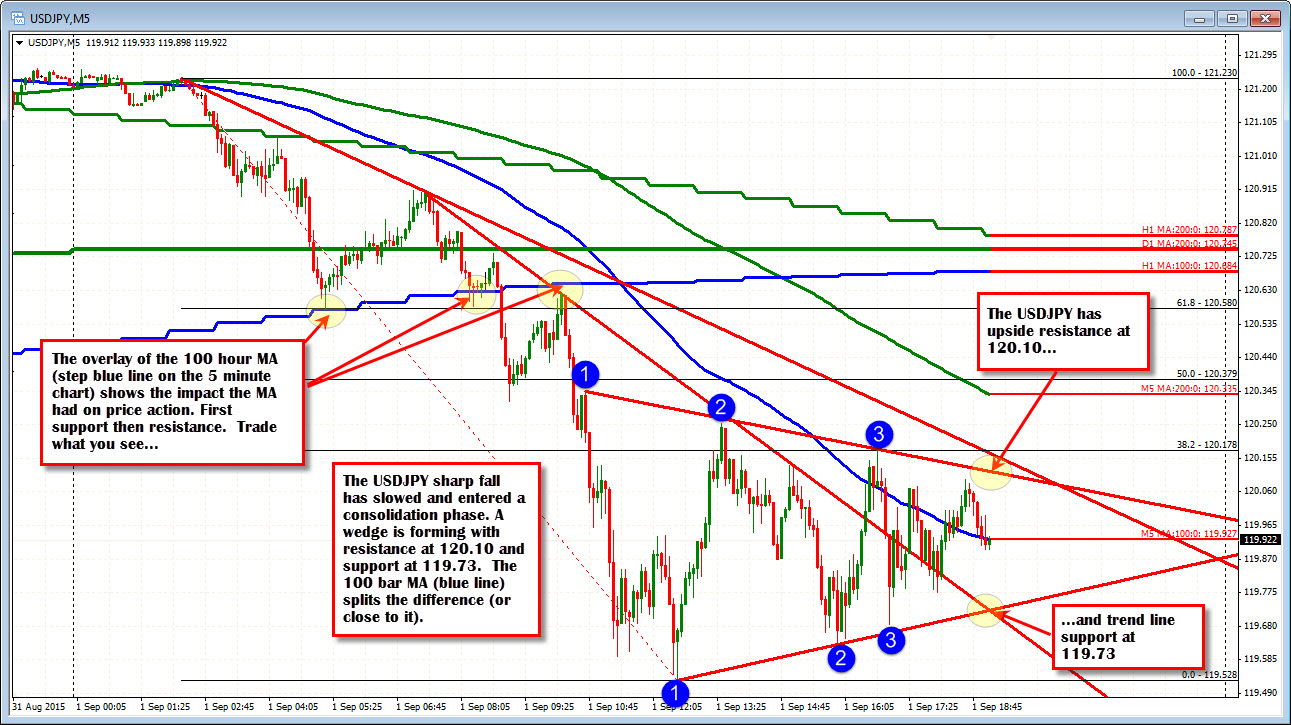
- The 200 hour MA (step green line near top of the chart above) was the first to be broken and then tested before moving away.
- Next came a combination of the 200 day MA (see D1 MA: 200.0 overlay line) and 100 hour MA (see H1 MA:100.0 overlay line). The price moved below the 200 day MA at 120.745, stalled at the 100 hour MA (blue step line) and after a correction higher, resumed the downward move. A final test of the 200 day MA was a signal to go lower. That was followed by a break and test of the 100 hour MA. Holding below also gave the sellers the AOK to extend lower (with little risk). That move led to the sharpest fall.
- After bottoming, more volatile up and down swings have characterized trading since that time.
What next?
The up and down consolidation has the pair trading under a topside trend line (currently at 120.10 and a lower upward sloping trend line at 119.73. The 100 bar MA on the 5 minute chart sits between the trend lines and gives a bullish or bearish barometer (we are just below the level now at 119.92. Ultimately, the market will have a decision to make - break higher or lower. ON a break the traders will be looking for increased momentum.
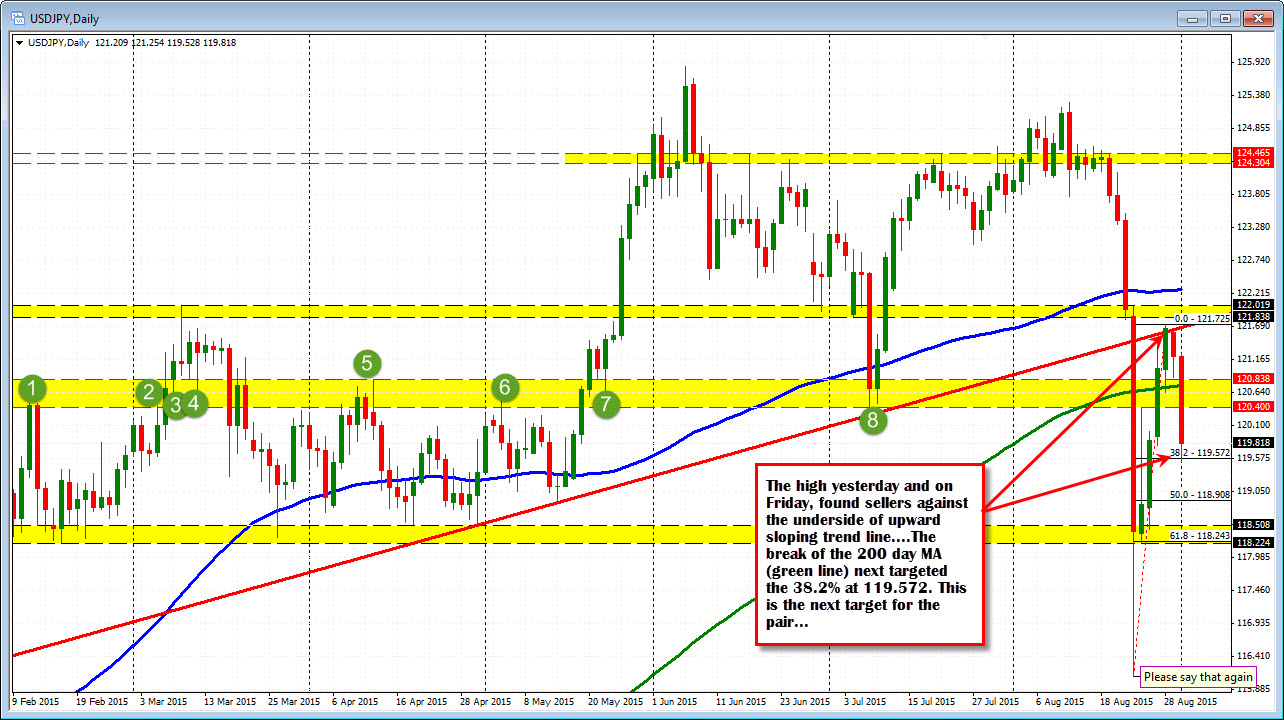
Looking at the daily chart, the fall today stalled near the 38.2% of the move up from last Monday's stock induced plunge lower (1000 Dow drop). That level comes in at 119.57. The low today reached 119.53 before rebounding. A move below the 119.73 level, will then look for the break and run away from the 119.53-57 area.
Consolidating? Yes. Watching for the next clue from the technical.