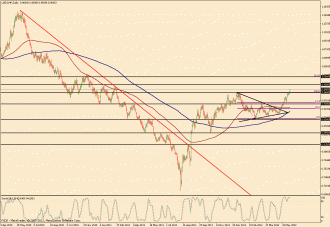
5/30/2012 – Price action on USD/CHF (a daily chart of which is shown), as of 5/30/2012, has broken out decisively above the key 0.9600 level, which is the around the top point of the large triangle pattern that was broken to the upside in the beginning of the month. In the process, USD/CHF has established a new 15-month high. The next major resistance target to the upside resides around the 0.9800 price region. Further to the upside, with continued bullish momentum, price could soon reach for the key parity level (1.0000), a level not touched since December 2010. Parity also happens to be the 161.8% Fibonacci extension target when measured from the highest price point in the mentioned triangle to the lowest price point in the triangle. Downside support currently resides around the broken 0.9600 level.
(Chart courtesy of FXDD – Metatrader. Uptrend lines in green, downtrend lines in red, horizontal support/resistance lines in black, Fibonacci retracements in purple, 200-period simple moving average in blue, 100-period simple moving average in brown.)


