
SNBs Jordan continues to state the CHF is overvalued
SNB's Jordan is harping on the wires how the USDCHF is overvalued. That story is nothing new of course. What does the technical picture look like for the USDCHF?
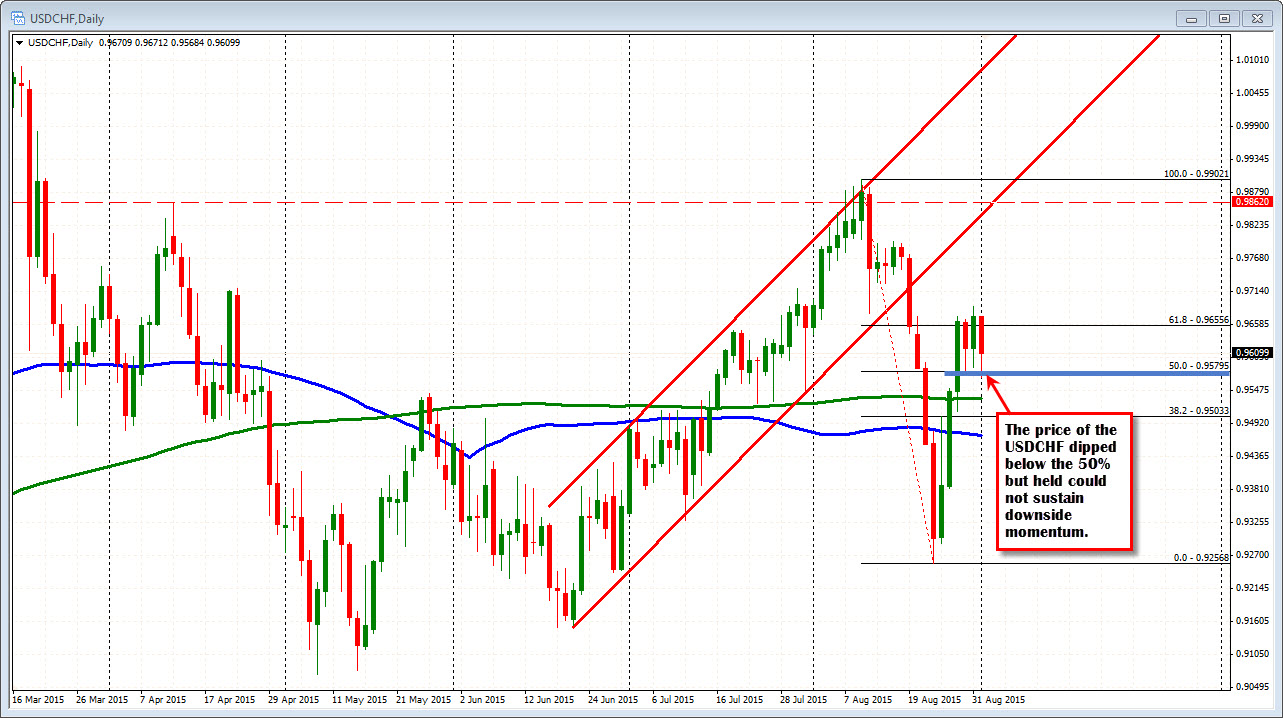
Looking at the daily chart, the pair has recovered more than 50% of the sharp move down on the stock market woes (the pair bottomed on the day the Dow plunged 1000 points). The recovery off the lows has seen the pair move above the 50% of the August move lower (see chart above). The last three days has seen the price test that midpoint level (at 0.95795 - see chart above). but so far, the pair has been able to keep a bid. With the current price at the 0.9600 area, the pair is still 300 pips away from the high reached in August at 0.9902, but we are also back above the 100 and 200 day MA (blue and green lines).
How about the shorter term hourly chart?
Looking at that chart, the price today is lower. The price earlier fell below the 100 hour MA (blue line in the chart below, but quickly rebounded. The pair is consolidating between support and resistance trend lines, with the 100 hour MA (blue line) holding support over the last 4-hours of trading.
Given the meltdown in the stock market, there has not been a move into the CHF. Yes, the price is down today, but the support is holding so far suggesting there is a reluctance to head into the "safety of the CHF" seen in August. Traders are instead leaning against support. Nevertheless look for a break of either the upside or downside trend line on the hourly to provide the next directional clue. Those levels come in at 0.9584 below and 0.9640 above. The 100 hour MA is currently at 0.9604.


