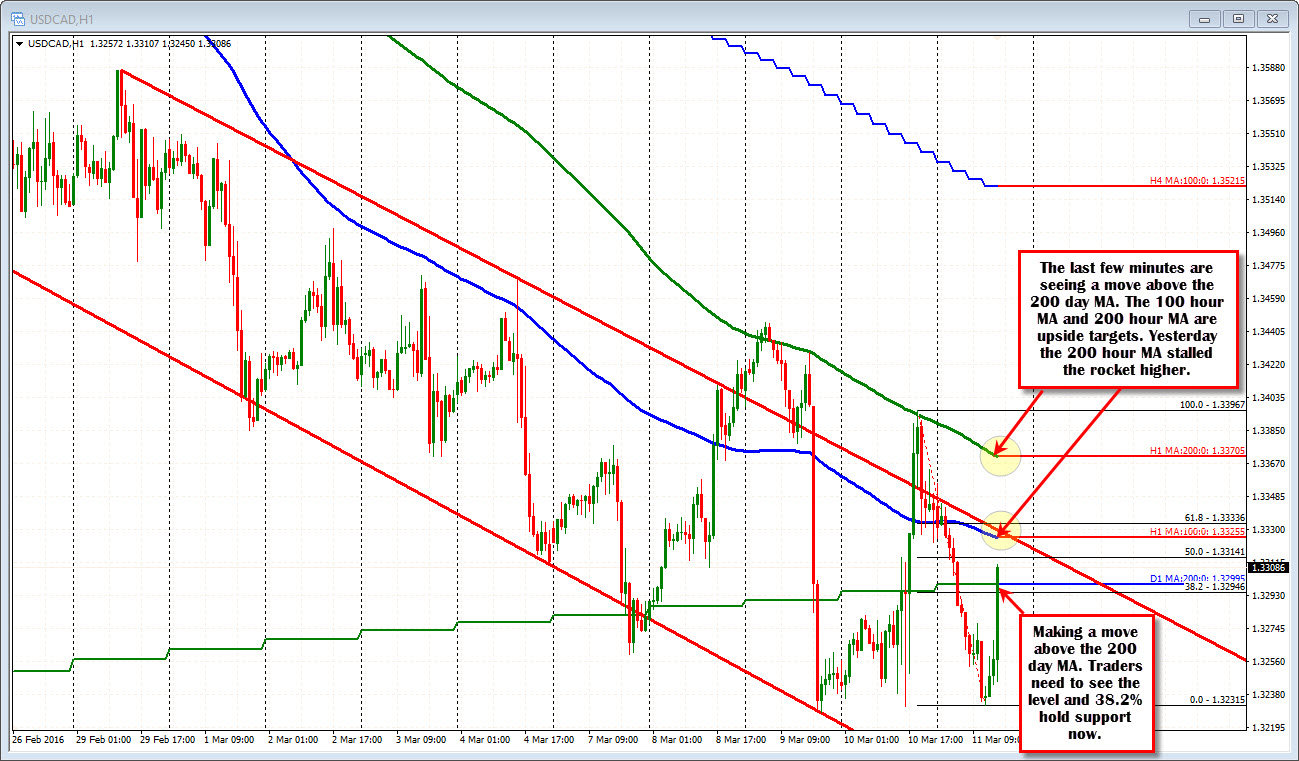
Dancing above and below the 200 day MA.
The USDCAD has risen after the worse than expected employment report.

The pair initially moved to and through the 200 day MA on the first push. We are trading back below currently. The level comes in at 1.3299.
Yesterday, with all the volatility in the EURUSD (and the dollar) the pair danced above and below that MA in expected fashion before racing higher and stalling at the 200 hour MA (green line in the chart above). Today, higher oil prices (new 2016 highs for Crude oil contract) had the pair back on a downward slide, but a triple bottom (lows at 1.3227 and 1.3231 both yesterday and today) provide good support now.
So there has been a race to 200 hour MA resistance. A race to triple bottom support now, and a 200 day MA in between. If the upside is the chosen path the 100 hour MA (blue line) will be another hurdle to get to and through (at 1.3325). Then the 200 hour MA of course. It may also need some help from oil which is off the highs at $38.50 currently.


