Test 61.8% retracement area
The USDCAD has been able to keep the bears in control post the better than expected employment data earlier today. Higher oil prices are also helping with Crude oil futures up over 6% on the day.
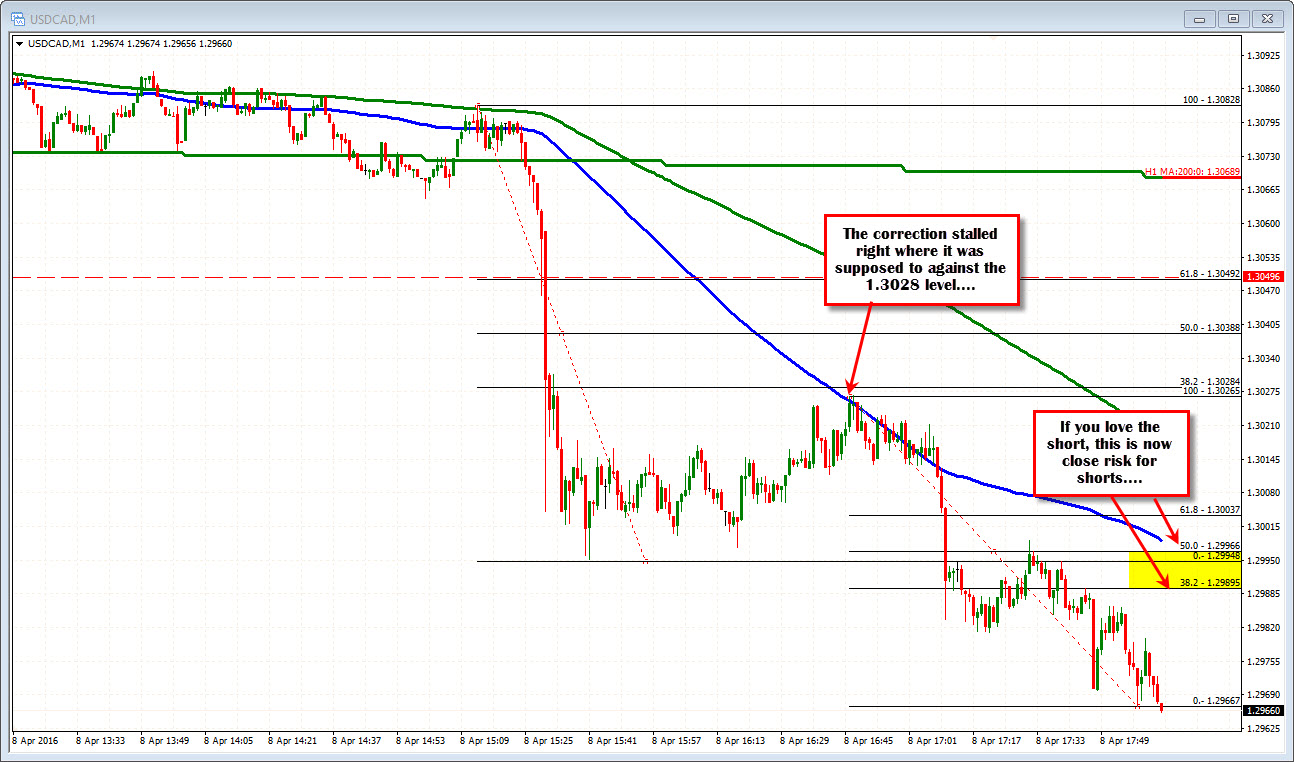
Technically, the corrective move after the employment fall, held right at the resistance area outlined in the the prior post (CLICK HERE). The high corrective price moved to 1.30268. Sellers kept that lid on the rebound and the selling continued.
What now?
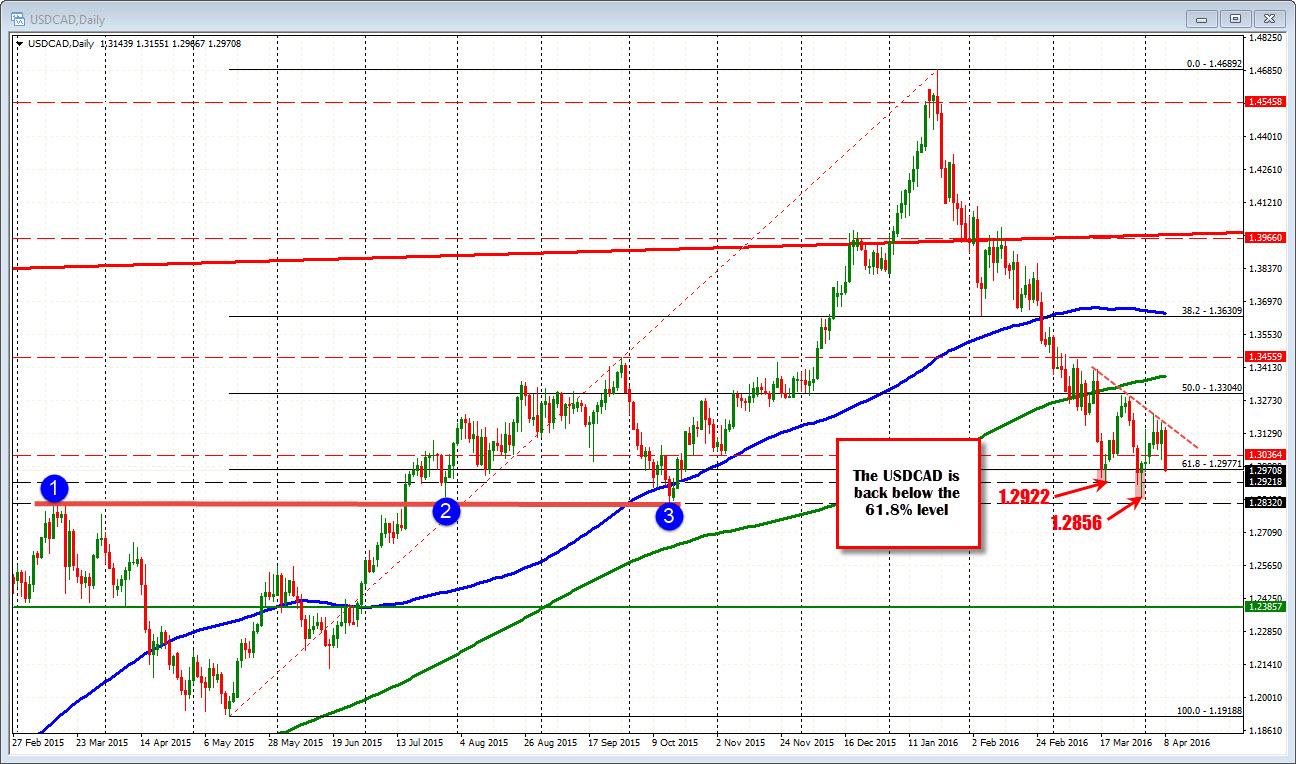
The price has extended down to 1.2970 so far. Looking at the daily chart, the 61.8% of the move up from the May 2015 low comes in at 1.2977. We are currently trading at 1.2975. In March the price fell below this line and extended to 1.2922 and 1.2856. The 1.2832 level was a low from October 2015. It was also a high going back to Feb 2015. Those are the targets given continues downside momentum.
Where is risk. The last leg down (from the 1.3026) has the 1.2985-966 as the 38.2-50% correction zone (see yellow area in the chart above). Stay below and the sellers remain in control, the trend remains "on". If new lows are made, extend the fibo down with the price.
When will it end? Reach a target on the daily. The next one at 1.2922 and profit takers enter, OR have the buyers win a technical battle on the upside (i.e. get above the 38.2-50%).