
The loonie continues to lose its connection with oil
And so the USDCAD continues to drop while oil prices aren't doing an awful lot.
The 100 dma has been breached and we're below it as I type. Should we hold below we're likely to see further falls and we might pay a swift visit to the 61.8 fib of the Oct swing up.
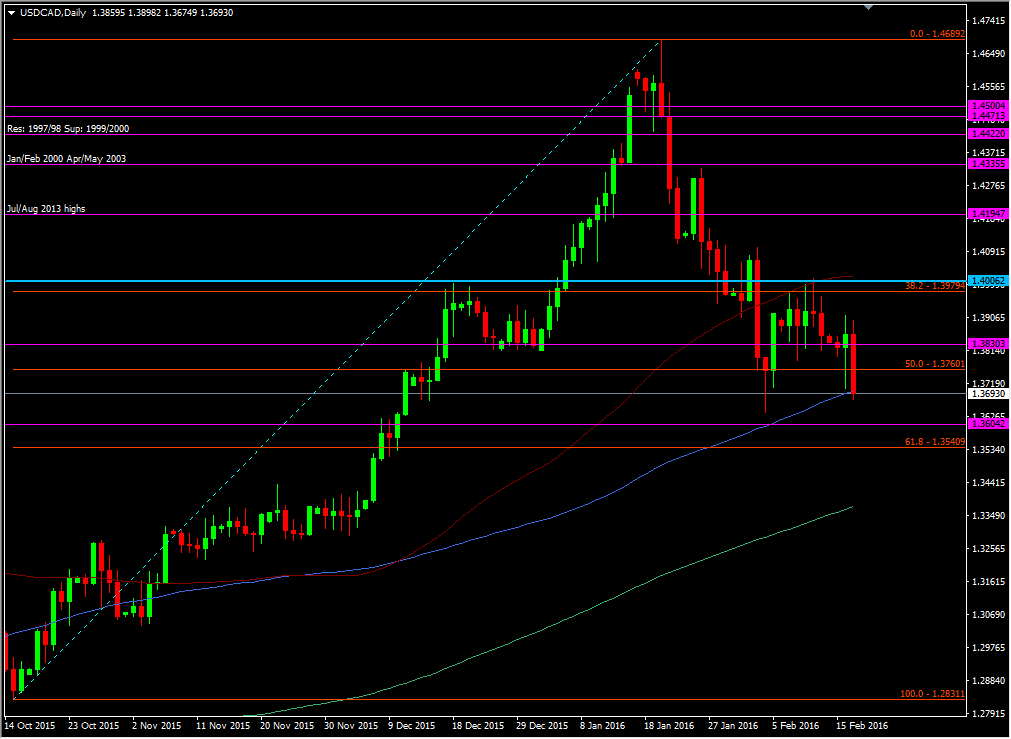
USDCAD daily chart
You head and shoulders aficionados are probably loving this chart right now.
Taking a wider look the 38.2 fib of the June 2014 move comes in down at 1.3135 so that's an area to keep an eye on if we do see a decent blow out. The break of the Oct 61.8 fib could be a catalyst for that.
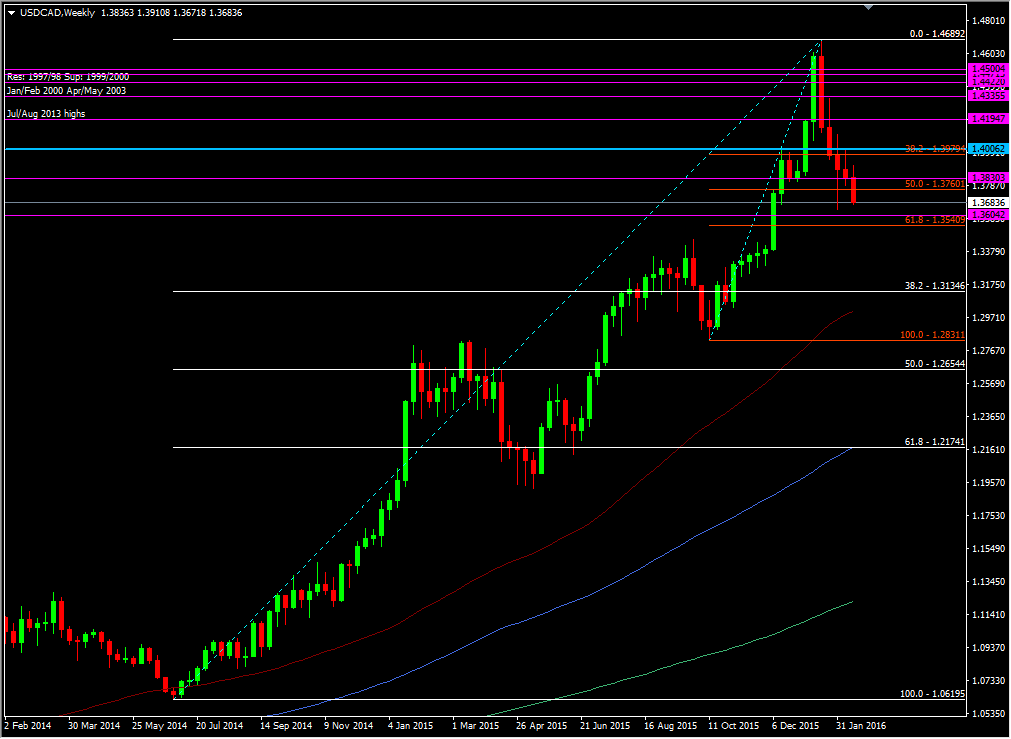
USDCAD weekly chart
Correlations are good until they stop, and no one sends us an email to say when that's going to happen.
It's another currency to add to the mess of things right now but at least it's one that's showing more willingness to trend.
At the start of the year this pair was my tip for a post-Fed hike short trade. I could look at that chart and say what a great call that was. The thing is I can't because the move has been nothing to do with the Fed up to now. The detachment from oil suggests that some normality is coming back to the pair but there's likely further to go. That's another reason why we don't get married to our ideas or strategies when the PA or fundamentals tell us something completely different.

