
Moves above the 200 day MA
The US debt market is seeing a steepening of the yield curve. The 2 year yield is down -1 BP but the 30 year yield is up 5.5 BP. The 10 year is up about 3 BP.
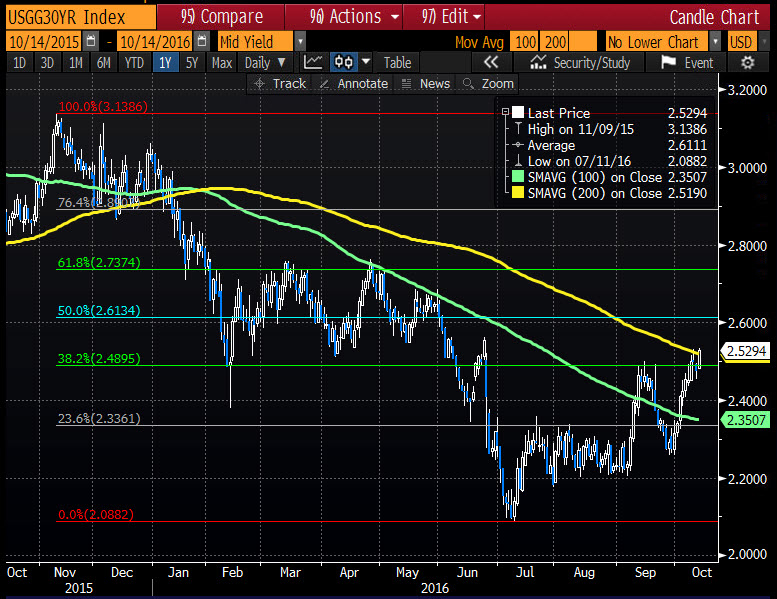
Looking at the 30 year yield, it is moving above the 200 day MA at the 2.5190%. That is 1st time moving above since January. The current year is trading at 2.5317% currently. This is the highest level since June 23rd - right before the Brexit vote in the UK.
Looking at the 10 year yield, it moved above its 200 day MA on Tuesday and closed above that MA line since that break. Admittedly, the break did not exactly ignite a huge spike higher. In fact, yesterday, the yield dipped below the line but was able to close just above the MA line.
Today, the 10 years low yield stayed above that MA line. So I will give the upside the benefit of the doubt. Like the 30 year yield, the break is the first since January. NOTE: The yield is also above the 38.2% of the move down from the November high. That comes in at 1.7217%
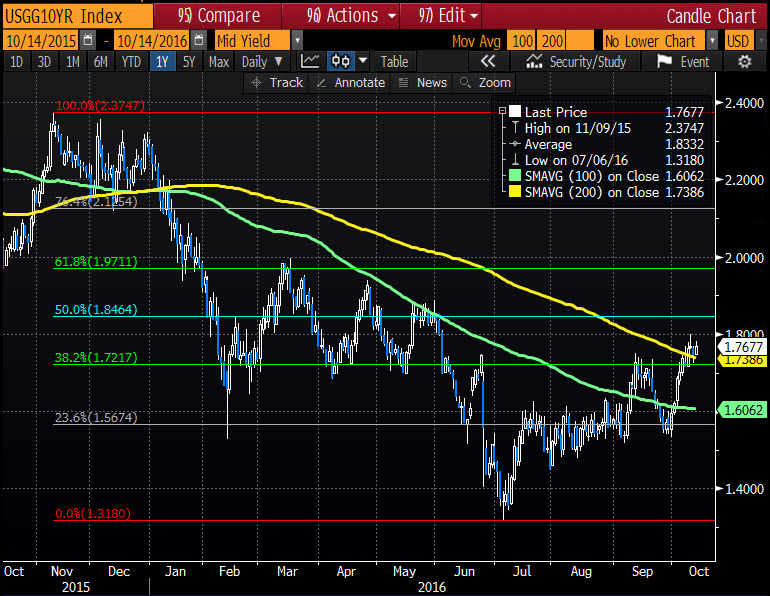
The move in yields suggests that the traders have been pricing in some Fed tightening at least. However, with the world flush with cash, it is hard to see a sustained rise in yields unless inflation spikes and remains elevated. Nevertheless, the technicals are looking more positive as long as the yields stay above the key moving average levels and there is potential for a further move higher. The 50% of the move down from the November high comes in at 1.8464% in the 10 year. The 50% in the 30 year is up at 2.613%. Those are targets if the momentum can be maintained.

