
What the weekly charts say as worries about US economy fade.
The dollar turned around in a big way on Thursday and Friday. The Fed held steady with its optimistic outlook and a slight uptick in economic data was all it took to reverse the dollar slump after the post-GDP slump.
Looking at the weekly charts, a few look awfully attractive for US dollar buyers.
1) AUD/USD
There's a gravestone doji in what looks like a false breakout above 0.8000. The Australian economy is still very-much slowing. But in the week ahead it's all about the RBA. Stevens is one of the toughest G10 central banks to read. The latest chatter has been about cuts. I don't think they will happen and a bounce afterwards will provide a fresh opportunity to sell.
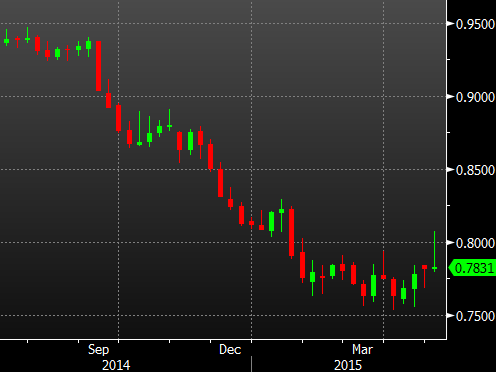
AUDUSD weekly
2) GBP/USD
The cable chart is very similar as it topped out ahead of 1.5500 and then reversed in a gravestone doji. As Ryan wrote about earlier,the wheels are not coming off of the UK recovery yet but they're looking rather wobbly.
The nearly-200 pip drop in the pound today is too much to chase but even a 50 pip bounce is enough to sell as election jitters ramp up early next week.
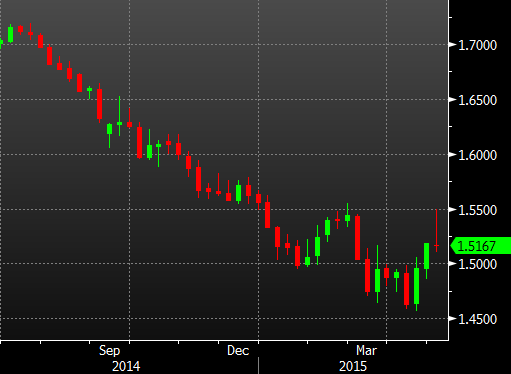
Cable weekly
3) USD/CAD
There are a few reasons for not liking the Canadian dollar in the week ahead.
- Poloz is wildly over-optimistic about the economy.
- Canadian data on the Ivey PMI, housing starts and April jobs likely to be weak.
- Oil has risen in 7 straight weeks and is due for a pullback
The third one is the main reason I like the trade in the week ahead. Oil companies reported earnings this week and there is absolutely no sign of slowing production. If anything, it was just the opposite. The risk I see is that WTI blows off to $65 and then starts lower but for all the declines in oil, the spec data still shows a very crowded long trade.
There's probably a bit more time for patience in this one, perhaps even waiting for a retest of 1.2000 but I think an opportunity for longs is coming in the week ahead.
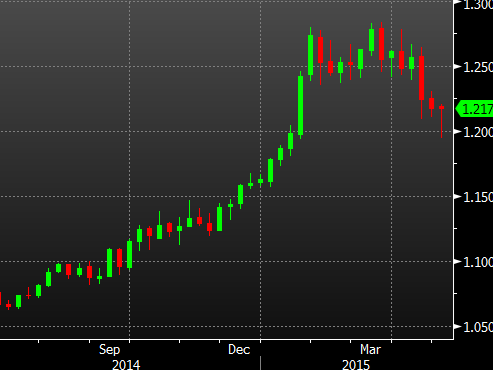
USDCAD weekly

