
...but near a lot of resistance too
The GBPUSD ended last weeks trading at the lows for the week and at the lowest level since March of 2009.
On Monday that low was extended from 1.3852 to 1.3840 and then 1.3835, but when the momentum could not be sustained, the pair rallied higher to the 100 hour MA (blue line in the chart above).
Tuesday and into Wednesday midday, there was mostly up and down action - and looks below the 100 hour MA as well - but that selling could not muster much new selling support and buyers too control. The rally on Wednesday afternoon extended higher - breaking above the 200 hour MA in the second half of Wednesday's trading. Buyers in more control.
Thursday saw the pair correct to the Feb 26th high and move to the 100 bar MA on the 4-hour chart (blue step line in the chart above). It stalled and corrected lower into the employment report.
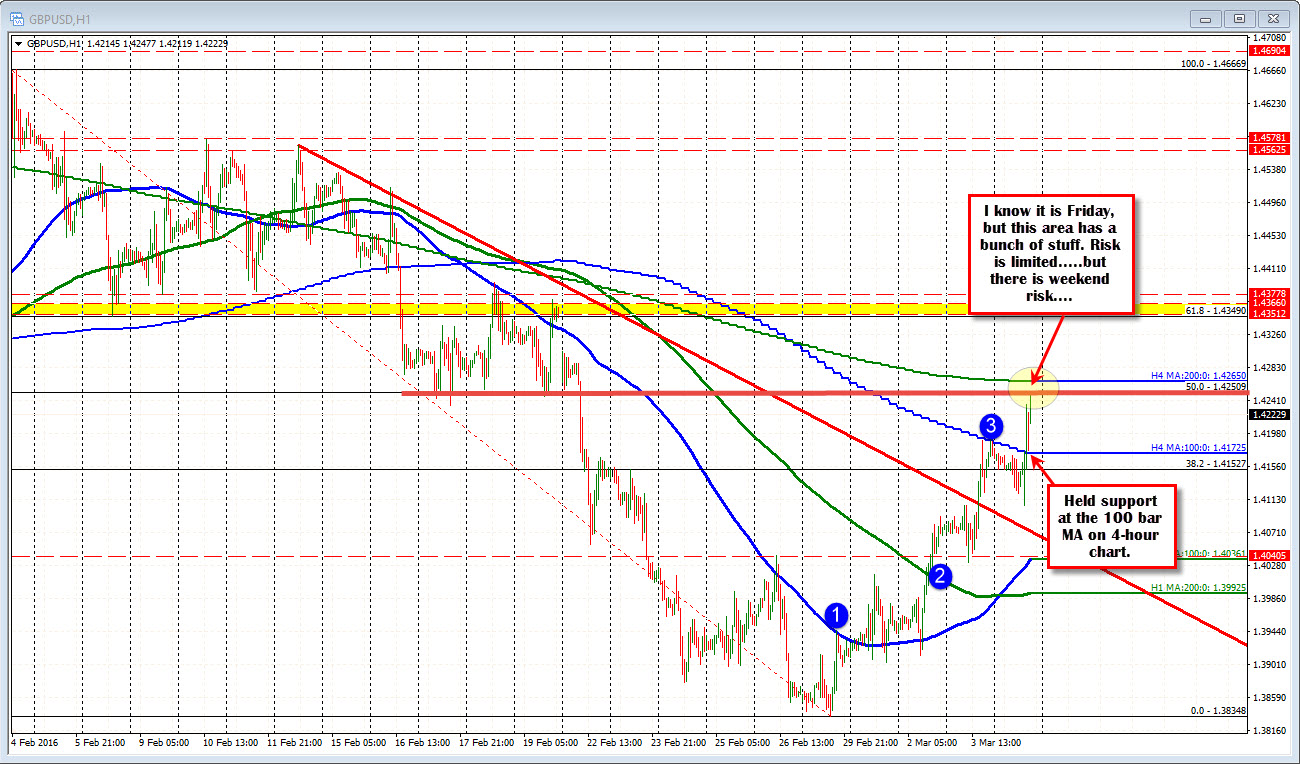
Today has seen the fall on the headline jobs report, recovery and move back above that 100 bar MA on the 4 hour. Notice how on the last corrective move lower, that 100 bar MA held support. Buyers have been there this week on the dips.
The Rally took the pair oh so close to the 50% retracement of the move down from the February 4th high (way up at 1.4667 level). That midpoint comes in at 1.42509. The high just reached the 1.42477 - 3 pips shy. The 200 bar MA on the 4 hour is at 1.4265. Also, low prices from Feb 17-19 are in the area too.
So this area (between 1.4250-67) has a bunch of resistance. It should attract some profit taking with stops above. But remember it is Friday so risk increases over the weekend.
Overall, it has been a week for the GBPUSD that eased fear of Brexit, and saw the 7 year itch at 7 year lows fail to make a break for it. That failure at the lows, was step one in a rally that saw the pair move 415 pips. Now comes the harder part with lots of resistance. So there is likely to be a breather. If it holds today, next week will be about the 100 bar on the 4-hour below ans the 50% and 200 bar above.

