
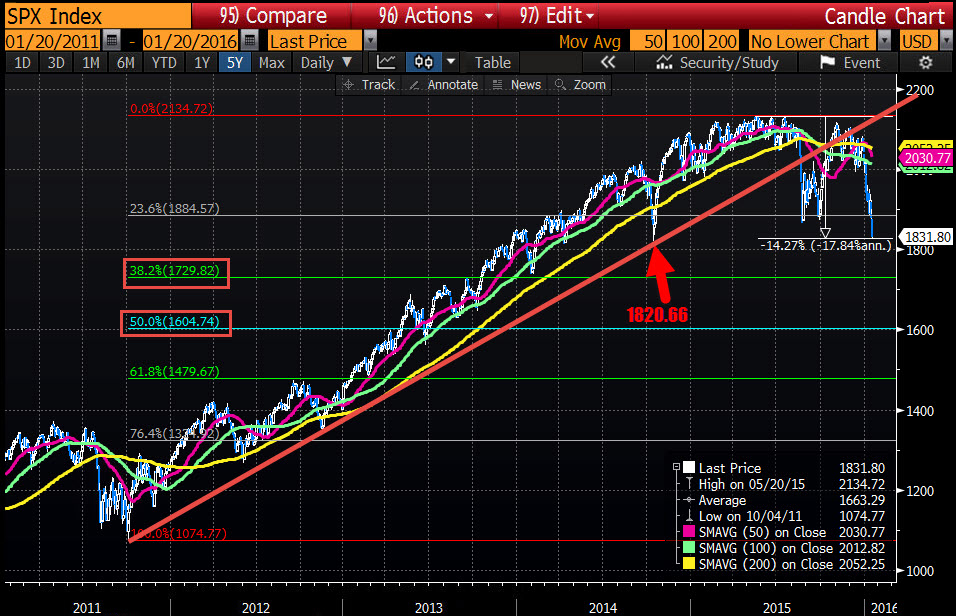
1820.66 is the October 2014 low
The S&P is down 2.47% and currently trades at 1835. The low extended to 1825.00 - close to the Ebola driven low of 1820.66 back in October 2014. From the high, the index is down about 14.3%. The 38.2% of the move higher from the 2011 low comes in at 1729.82. A 50% correction of the move higher would go all the way to 1604.74. That is a 50% of the move higher. A 50% decline like what was seen in 2000 and 2008 is something different. A 50% decline in the S&P from the high would be to 1065ish. That would be quite a drop from here.
In 2000 it was the cracking of the internet bubble. In 2008 it was the debt crisis. In 2016 it is oil, it is China. It may be the overvaluation of tech and biotech. Low inflation. Too much central bank.
When the apple cart gets unstable it can have those ancillary effects on other things. Just think, if sovereign wealth funds, suddenly don't have as much wealth because oil is $27 a barrel, what does that do to flow of funds into stocks?
Eventually oil rigs going off line, future projects shelves or delayed will bring supply and demand back in line (for all commodities there is a choice to not increase supply if the price gets too low) and the price goes higher. Is that better? Funny how rooting for higher oil prices might be a rallying call. The point is, the cart continues to wobble. Stocks trading at the lows.

