
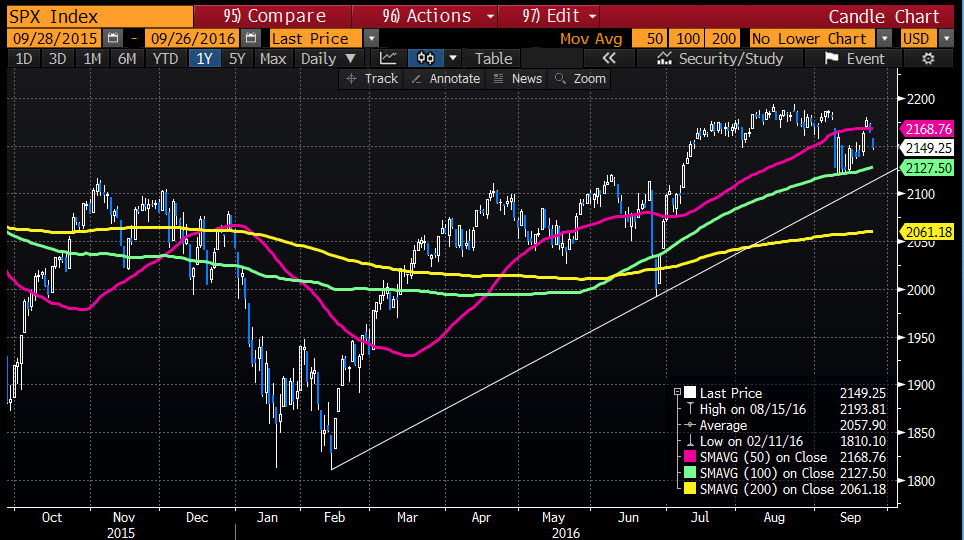
Below the 50 day MA/Above the 100 day MA
Last week, the S&P Index moved above the 50 day MA at the 2168 area on the back of no action by the Fed, and thoughts that perhaps the Fed might not get a single ease in before year end. That sentiment came despite 3 dissenting voters who preferred an immediate Fed hike.
On Friday, however, the tide started to turn a bit. Technically, the price moved below the 50 day MA, and today there has been a gap lower. The index is currently trading between the 50 day MA above and the key 100 day MA below.
With the Presidential debate on tap later today, the potential exists for further fall out from politics and the potential realization of President Trump or Clinton for that matter. Let's face, neither are well liked, and that could concern the global investment community long US equities. So the focus shifts away from the Fed and onto the US Presidential candidates.
As mentioned above, the key level (and target) on the downside comes in at the 100 day MA (currently at 2127.50). That MA held support earlier in the month. There were four days when the price pushed against the level, but could not get below.
That MA - at 2127.50 - will be key going forward with a break likely leading to further sellling/liquidation. ON a break , the trend line (see chart above) comes in at 2113 level. The 200 day MA is further down at the 2061.18. The price fell below the 200 day MA in June for a single day before rebounding and moving to contract highs in August. It could be a target if things start to unravel.

