
Is the rally over? Walmart expect sales to be flat. Earnings to be impacted by tech in 2016
The S&P index is trading back below the 2000 level at 1995.43. The Percent of the move down from the July high comes in at the 1999.92 level. Moving back below that level after spending the last 5 days above is not the best. The 100 day moving average comes in at 2042.63. The 50 day moving average comes in at 1987.21. The high corrective price peaked at 2022.34 - about halfway between the 50% retracement level and the 100 day moving average. The September 17 high came in at 2020.86.
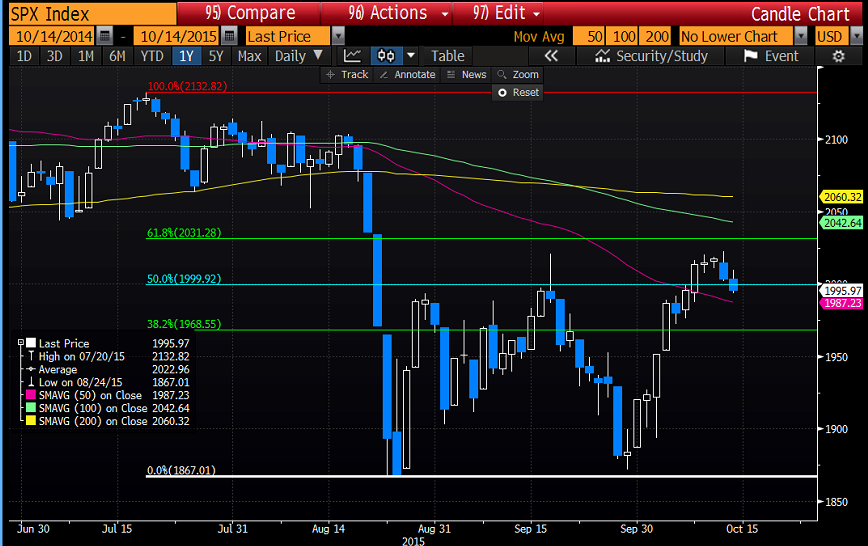
Staying below the 2000 level is a bit bearish for stocks.and could ultimately to another retest of the lows at the 1867 area. The market since August 21 has been up-and-down between that level and the 2020 area.
Walmart cuts sales forecast for fiscal 2016. They see 3-4% annual sales growth over 3 years. The stock is down 8.14% and it alone accounts for 40 Dow points (the Dow is down about 90 points)

