
100 day MA and trend line in the 2134-38 area
The S&P index is trading down 30 points or 1.4% on the day. The index is trading at 2133 currently. In the process, the index has moved below some pretty good support from a technical perspective.
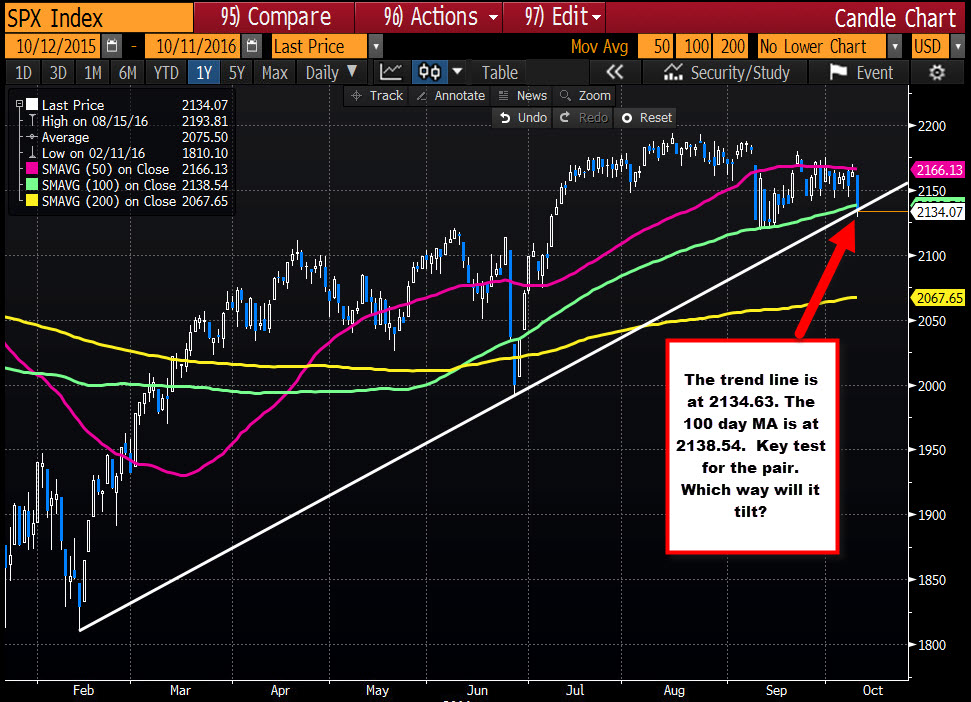
- The 100 day MA is up at 2138.54
- Trend line connecting recent lows cuts across at 2134.63
With the current price below both those levels, the index's bias is turning more bearish.
Now there is time until the close. The index may find the dip buyers to push the price back higher, but right now a close below the 2134.63 would be more bearish going forward technically. A more bearish clue is the lows from September found buyers on four successive days (see chart above). Today, those support buyers are not showing up (or at least they are not in a hurry).
Where can the index go?
The 200 day MA at 2067.65 would be a potential target if the price can stay below the aforementioned broken levels, and a momentum move gathers some steam. In June the price fell below the 200 day MA for one day, before rebounding (yellow line in the chart above).

