
Details of the September 2015 US Case/Shiller house price index data report 24 November 2015
- Prior 0.1%
- 5.5% vs 5.1% exp y/y. Prior 5.1%
- NSA 0.2% vs 0.4% exp m/m. Prior 0.4%. Revised to 0.3%
- National HPI 0.8% vs 0.4% prior m/m
- 4.9% vs 4.7% prior y/y. Revised to 4.6%
Steady price gains keeps the bubble risk low and continues to support the housing market. We did get a minor red flag from yesterdays existing home sales that sales were lower due to high prices in some regions. This data is lagging that by a month so we may see something here next month
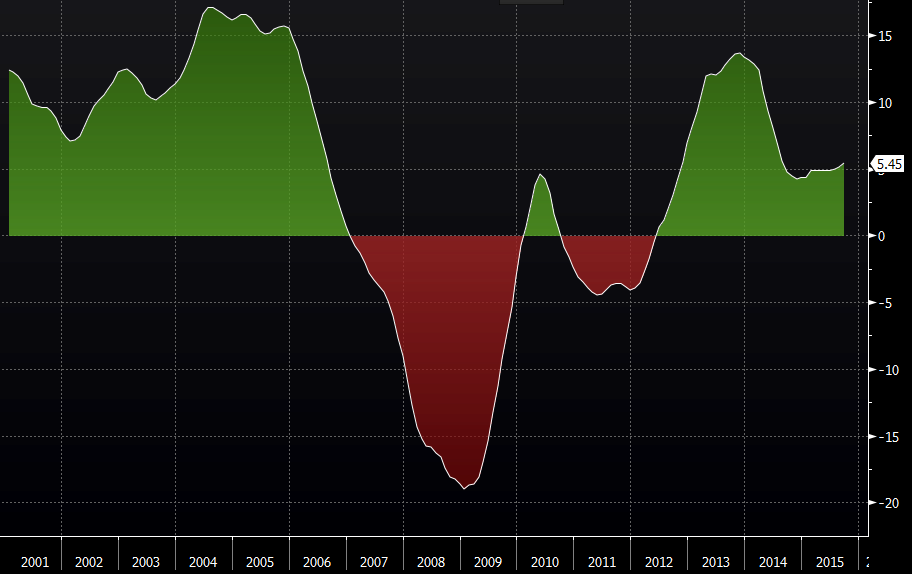
Case Shiller 20 city HPI y/y

