One bad day hurt, but that was it.
The stock market fall on Wednesday this week was scary. When indexes keep moving higher and higher, and you get something that might resemble a crisis in Washington, you can get days like Wednesday.
However, as has been proved time, and time again, Trump has more than 9 lives and the fall is looking like it was much ado above nothing.
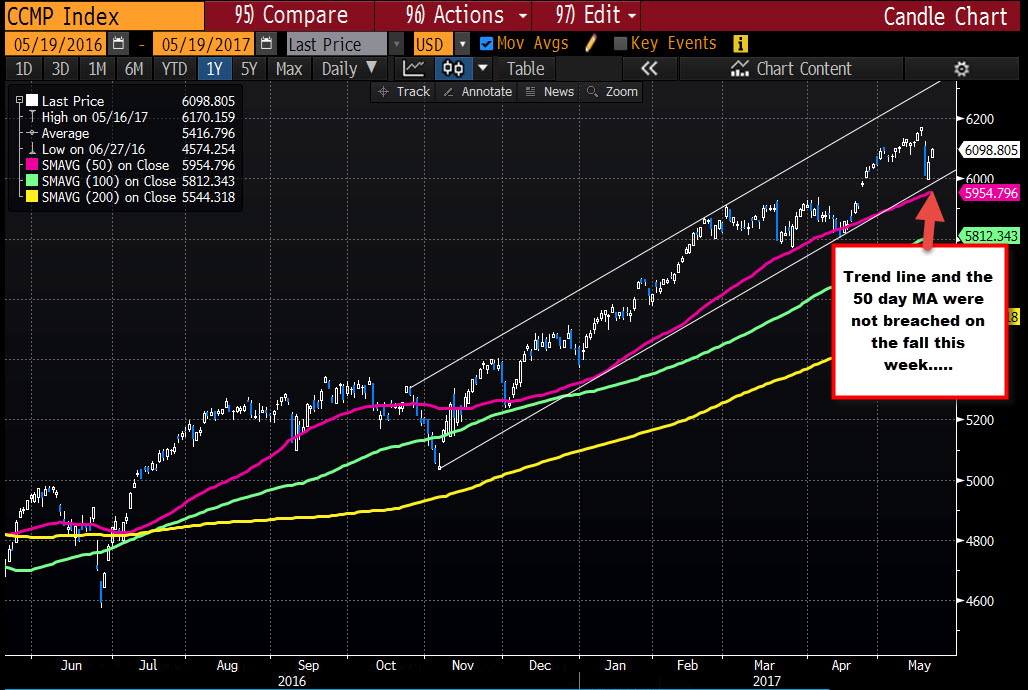
Looking at the Nasdaq chart above, the tumble on Wednesday (and into Thursday) took the price near trend line support AND the 50 day MA (at 5954.76), but neither was touched. In April, at least,the 50 day MA was broken (barely) over a few days. It is higher this month and still did not get close to breaking. Going forward, if stocks are going lower, the proof is in the trend line and the MA. If they can not be broken, the buyers remain in control.
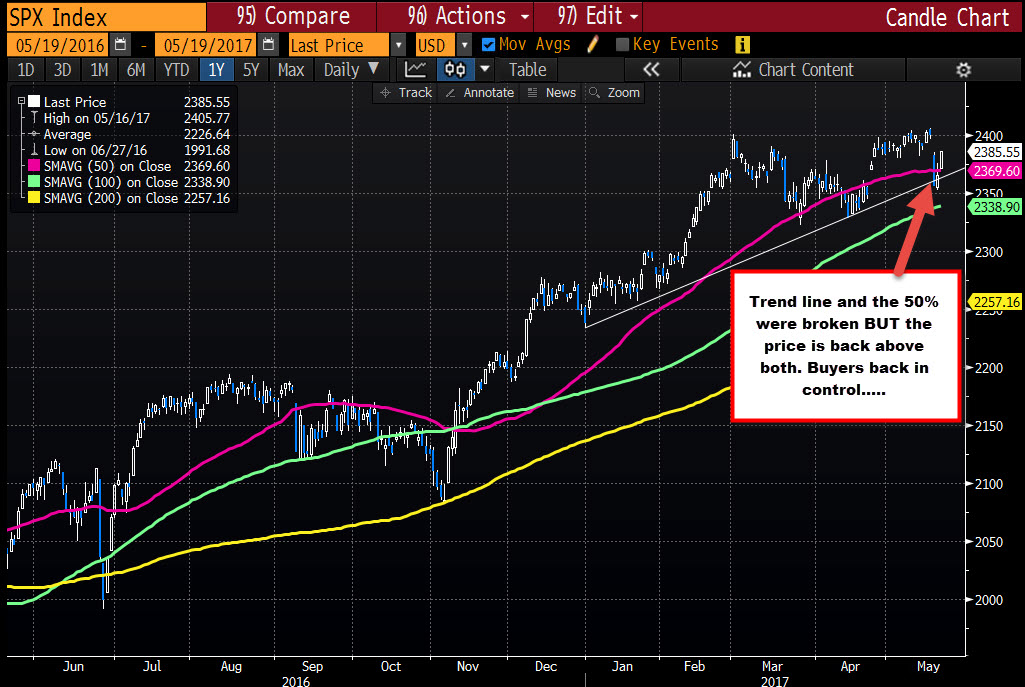
Looking at the S&P chart, the technical picture DID get a little scary, and rightfully so, that did give traders some cause for pause on Wednesday and Thursday. The 50 day MA was broken and closed below on both days. A trend line was also breached. However today, the low of 2370 was just above the 50 day MA at 2369.63. So technically, the break is a failed break and the bias is more bullish once again.
We don't know what may happen next week. What Trump may do during his overseas trip nor how the market will interpret it (and all the other stuff that will come out). However, we will always have the MAs and trend lines to guide us, and give us clues as to the markets bias. Yes....there may be false breaks, but there may also be significant breaks at times, that don't quickly rebound.
As far as this week goes, the move lower, appears to be much ado about nothing. The buyers are back in charge.