
It was a great string....
Nine tests. Ok one move below it (number 6) after the 200 day MA (green step line at point 6) was broken at the same time, but the momentum quickly faded. If you can look past that one "stop hunting" break, the USDCAD hourly chart had nine tests of the lower trend line. AMAZING.
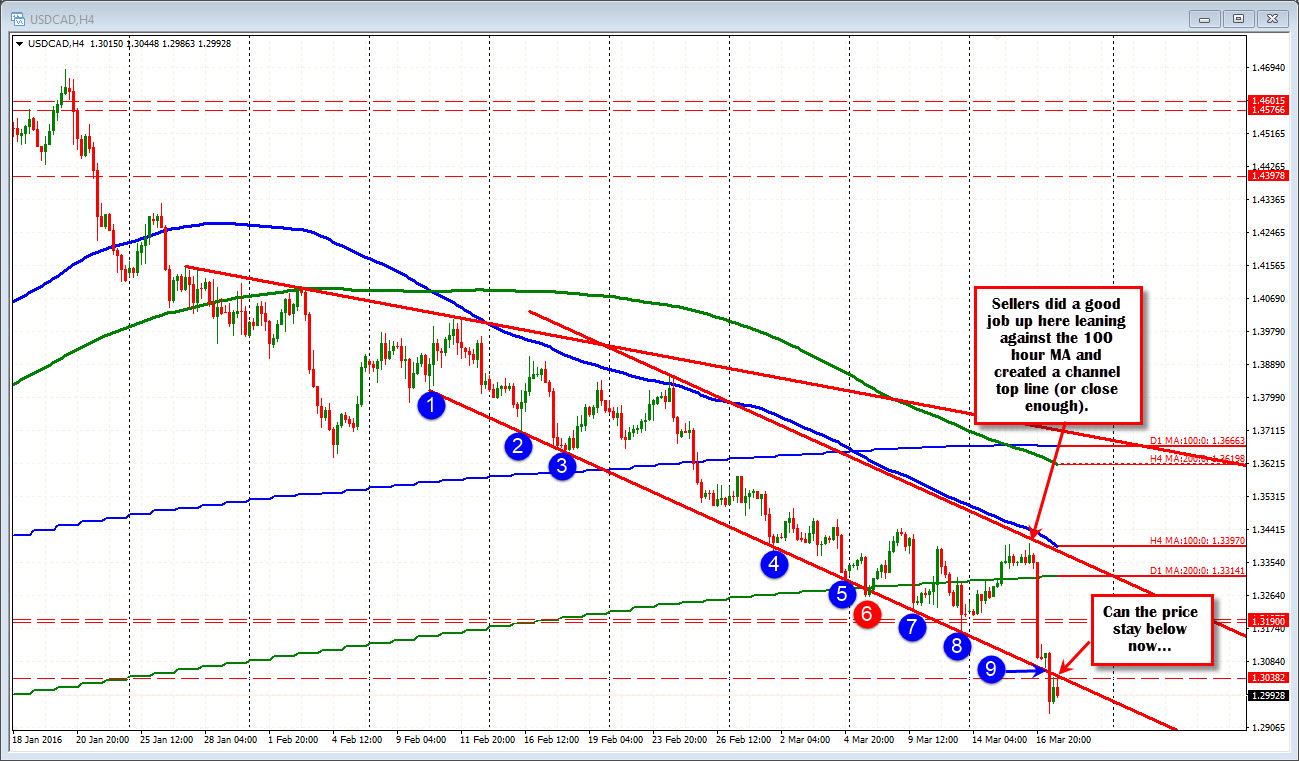
"And the trend line of the year on a 4-hour chart, goes to .... USDCAD"
So what now?
Well, the correction off the low tested the underside of the broken line. That level comes in at 1.3042 currently. If the move outside the confines of the trend line is something sellers can deal with, they will continue the selling.
If the exploration outside the comfort zone is too much to handle, a move back above the line may signal that the move lower is over for now.
The award is earned. Congrats on winning the "Trend line of the Year on a 4-hour chart" USDCAD. However, there have been many a "one-line wonder" which break and then fail. So it is up to you now. Can you keep the bearish momentum going? Risk is a move back above the.... trend line.

