Last 12 day, has seen 11 down days
Gold is tumbling once again. Looking at my chart, today would be the 11th of 12th down day. Ouch. The price peaked near the 50% of the move down from the January 2015 high at the 1189.07 (the high reached 1191.21). The fall, has seen the price move back below the 200 and 100 day MAs and a lower trend line along the way.
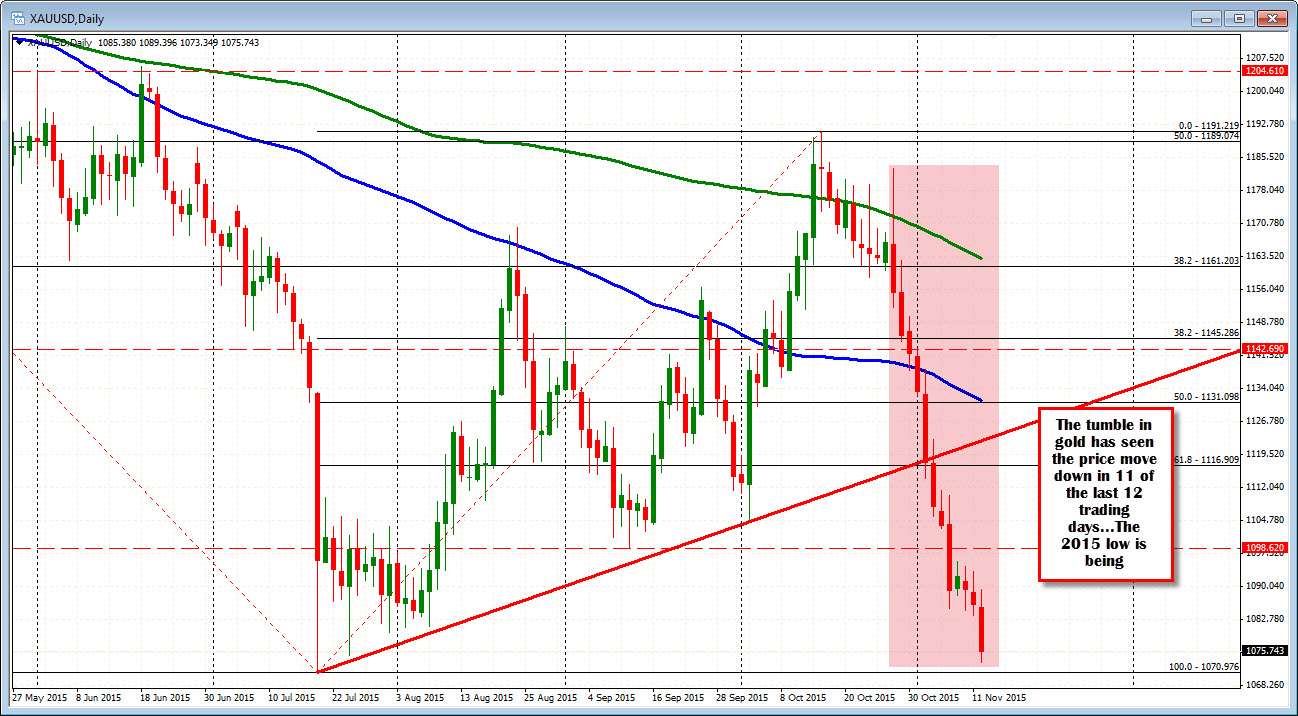
The precious metal price is now approaching the low from July and the low for the year at the 1071 area. A break below will send the price to the lowest level since February 2010.
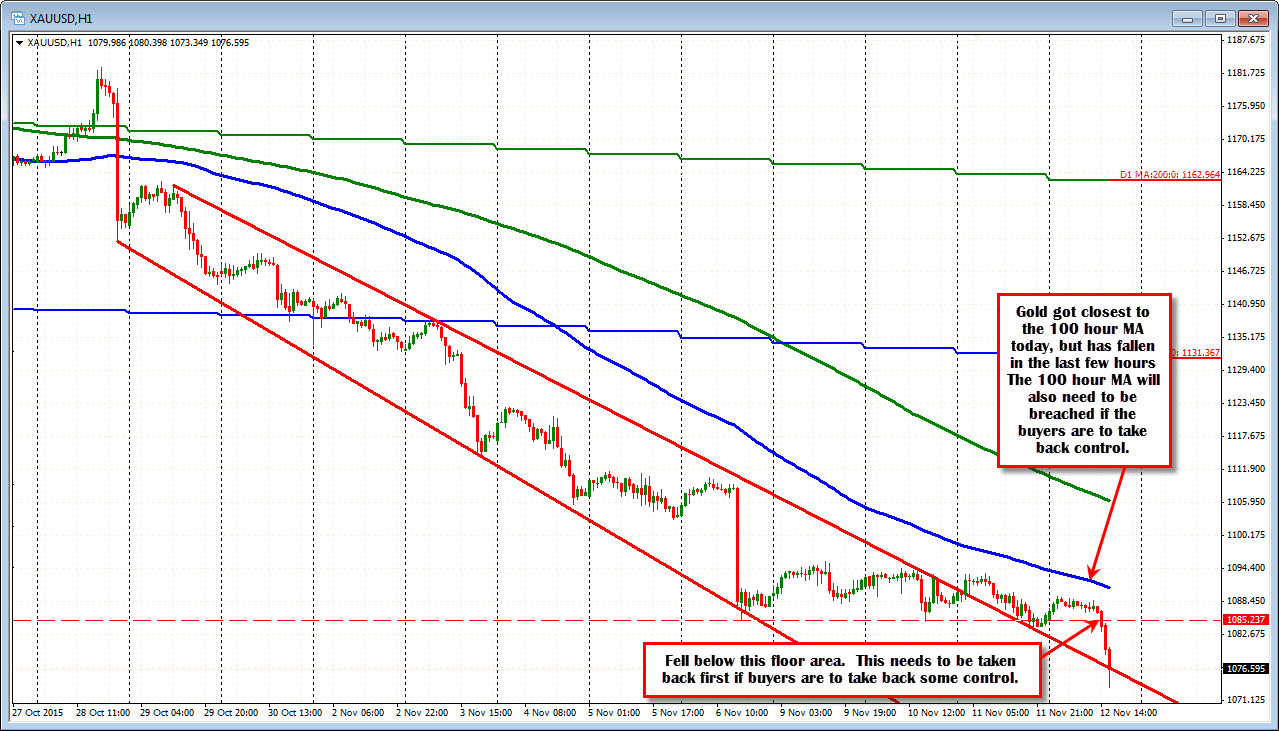
Looking at the hourly chart, the price fall has kept a distance between the price and the 100 hour MA (blue line in the chart below). The momentum lower has been slowing, but the break below a floor area at the 1085.25 area got the sellers going again.
If the buyers are to make a stand, a move above the old floor at 1085.25 and then the moving average will be eyed. The 100 hour MA is currently at the 1090.91 level and moving lower.