What technical levels stick out in the GBPUSD
The GBPUSD has taken a peek below the 1.5000 level in trading today as the market positions itself for the FOMC decision. The pair broke below the 200 hour MA yesterday afternoon in sort of a delayed reaction to dollar strength. The fall below the 200 hour MA accelerated the fall.
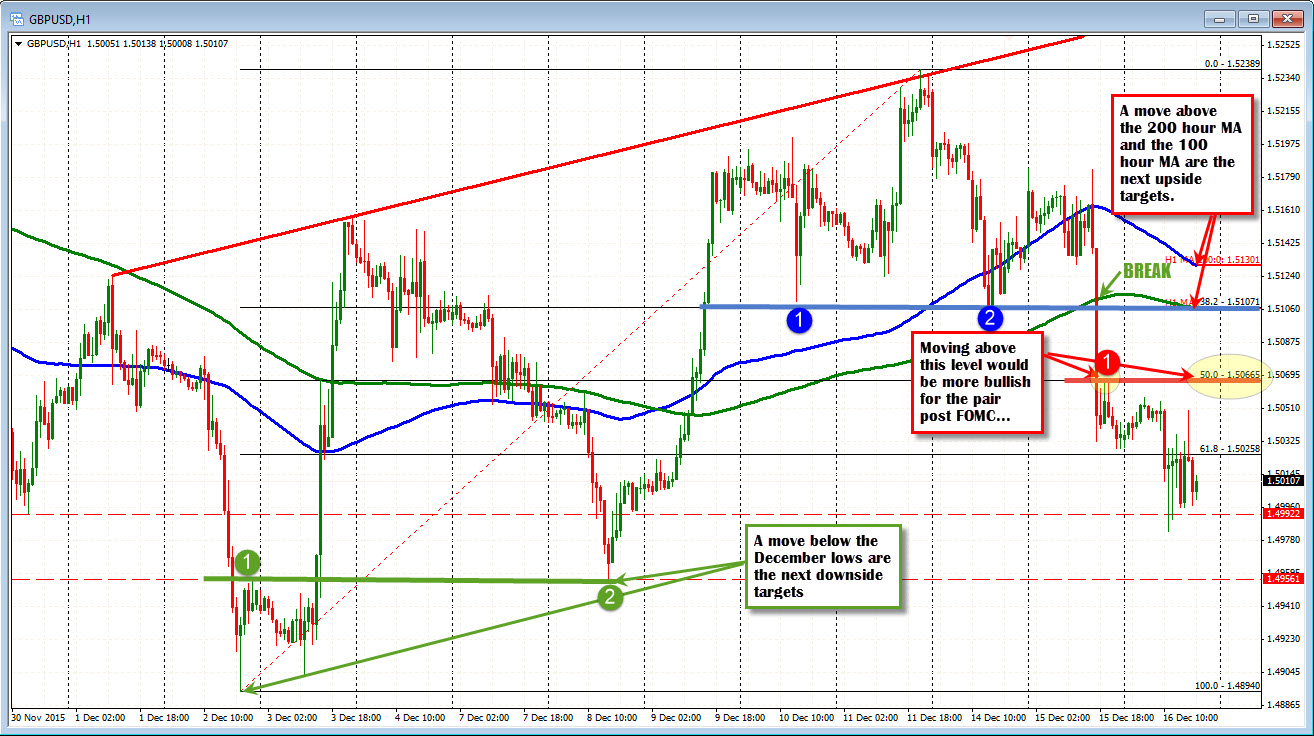
Today, the pair has spent some time below the 1.5000 level but each venture across the divide, has led to a bounce back. The high corrective bounce stalled at the 1.5050 level. Looking at the hourly chart, the lows from Dec 8, at the 1.4950 level and the low for the month at 1.4894 are downside targets through the FOMC.
On the topside - from this chart - the 1.5066 is the 50% of the month's trading range and that was the high correction price after yesterday's bottom was reached. That is a level that if the price moved above, the buyers would be encouraged. Also the 200 and 100 hour MAs at 1.5107 and 1.5130 respectively are targets on a bullish move.
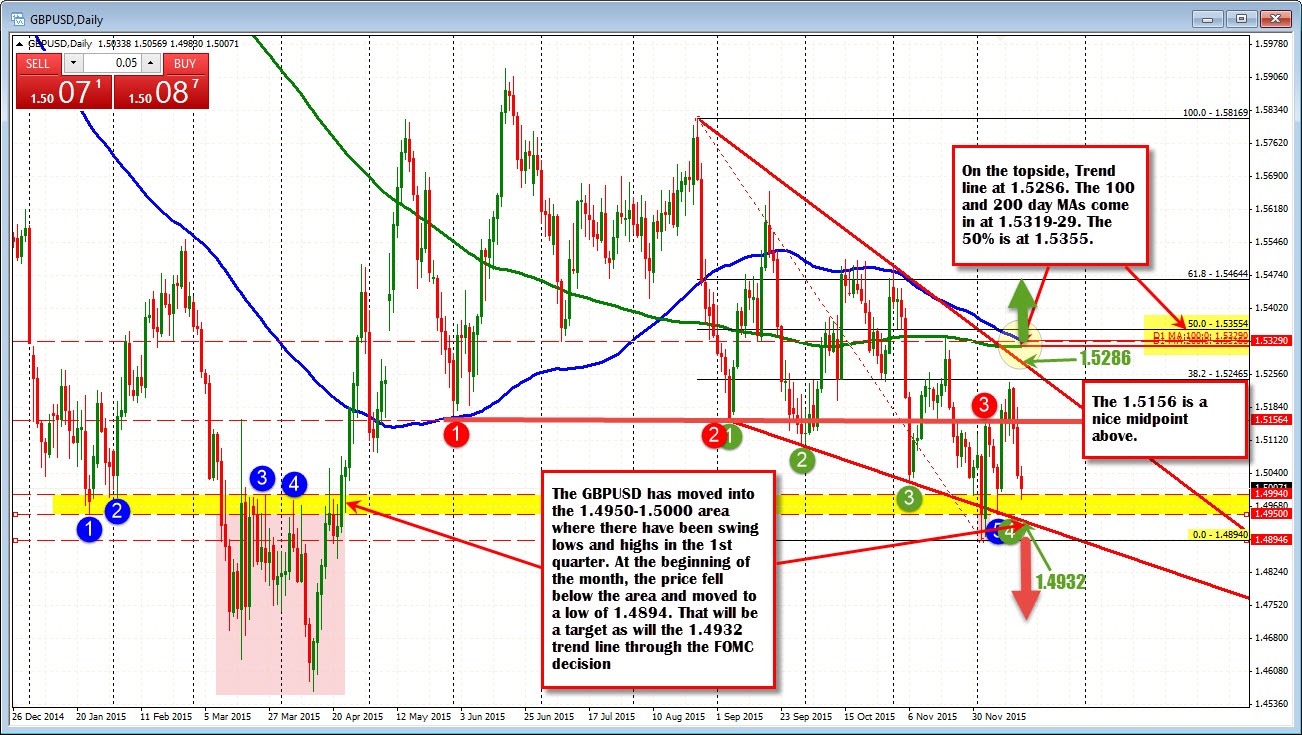
Looking at the daily chart below, on the downside the 1.4932 is a trend line that was broken earlier in the month but failed. That level is between the low price at 1.4894 and the 1.4950 level.
ON the topside on the daily chart, the 1.5156 has a few key swing lows in the area (in June and September - see chart below) The in 200 and 100 day MA, 50% retracement, downward sloping trend line are in the 1.5286-1.5355 area. If a squeeze is on after the hike, this should put a stop to it.