
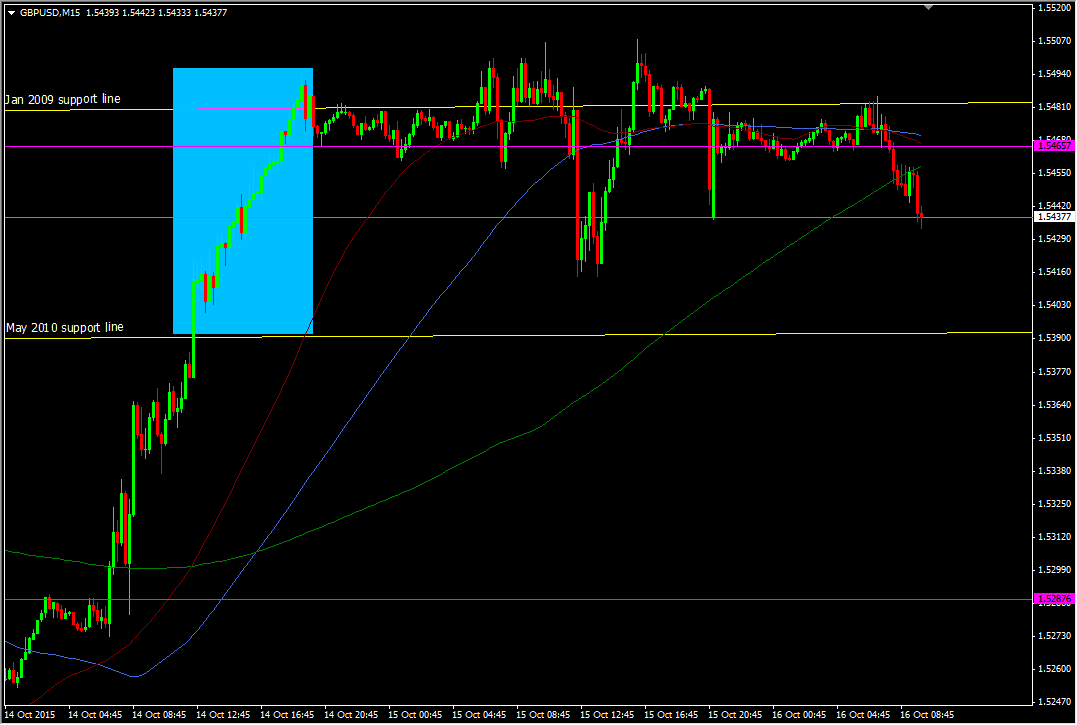
After the 300 pip run up from 1.5200 picking support yesterday was tough. Now we have some levels to watch
My worry yesterday was that after the quick rally to 1.55, any decent dollar strength heightened the risk that a retrace could be just as sharp. Whenever we see a big fast move up or down the first thing I do is look to see where the levels might develop. That can simply be where the move ran into support or resistance forcing traders to push a bit harder. A move stopping somewhere for even 10-15 minutes means there's something going on there and makes the level worth noting if the price then reverses.
In the run through 1.5400 these steps were virtually non-existent, so that's when I worry about how any sort of reversal will act
GBPUSD 15m chart
Today the picture is much clearer. Looking from the 14th, support first built around 1.5460, then down at 1.5410/15, then 1.5460 again, then at 1.5435/40 on that late drop yesterday. Now we've seen the 1.54305/40 level play out again just now. From nearly nothing to pick out, on Wednesday/Thursday, we now have levels that mean something
The price looks to be going sideways from here so the 1.54-1.55 range looks to be the boundaries right now. If the price is to go higher then we need to get and hold above 1.55. If it wants to go lower then the task is taking out 1.54
Depending on your style of trading these levels may or may not be ones you want to trade. That doesn't matter. The art of watching prices all day long is to build a picture whether you want to trade it or not. If you can learn to see the levels then it makes it easier to build your own picture for the ones that you do want to trade
Don't ignore watching the price moves because they don't fit in with your trading style. For example don't ignore the 15 minute chart because you trade the 4 hour chart. It's the exercise of watching that's important

