Have not have a closing hourly bar above MA since Dec 29th
This is a stripped down hourly chart. What do you notice? Since Dec 15 at 1.5163, the price has been below the 200 hour MA(green line). Since Dec 29th the price has been below the 100 hour MA (blue line). Those lines have kept a lid on the corrections. Until just a few minutes ago that is.....The price has just moved above the 100 hour MA at 1.4216
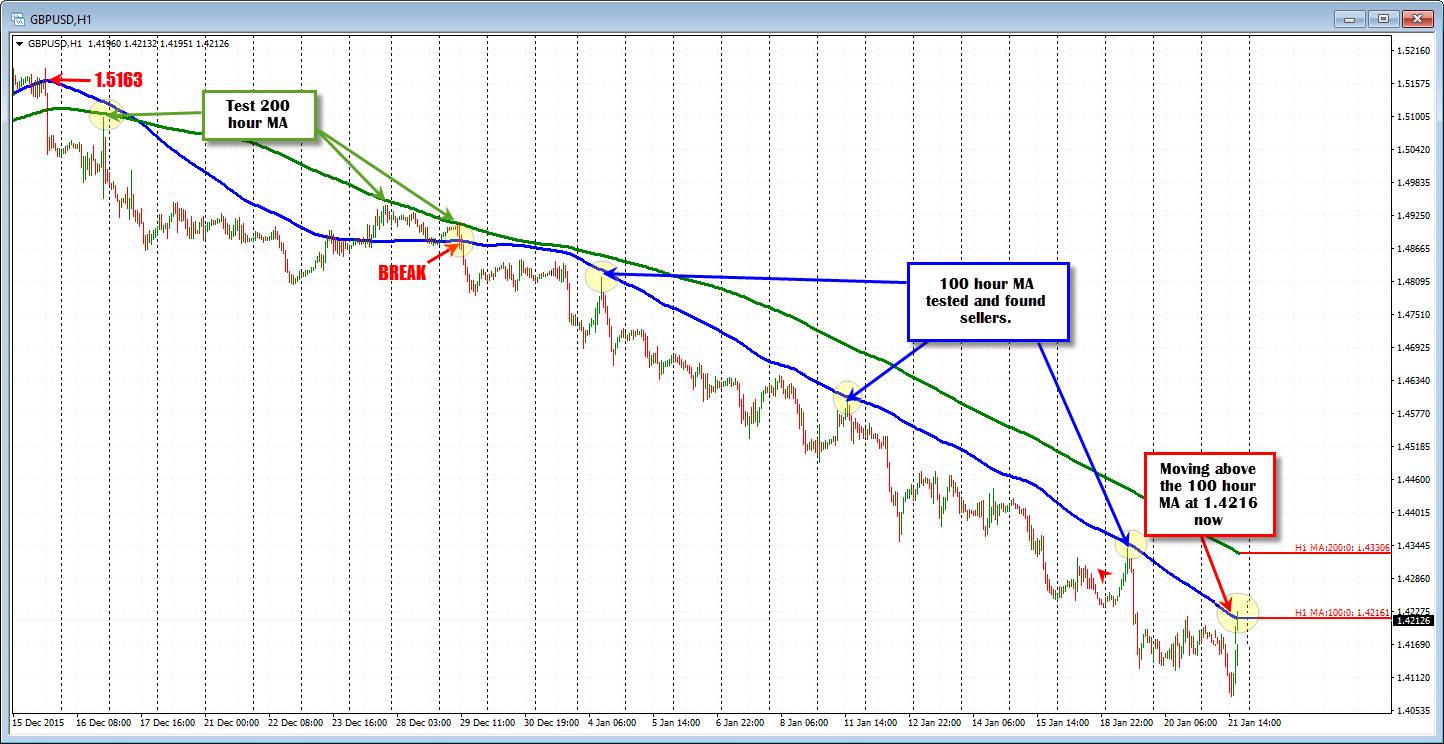
Is the tide turning? There is a change in the technical sentiment for sure. There is something new. The buyers have forced the price higher and stayed above support levels on the way (see earlier posts).
Now the price has moved about 150 pips from the low. The 100 hour MA is a key level..Yes, but has it gone enough for the day perhaps.
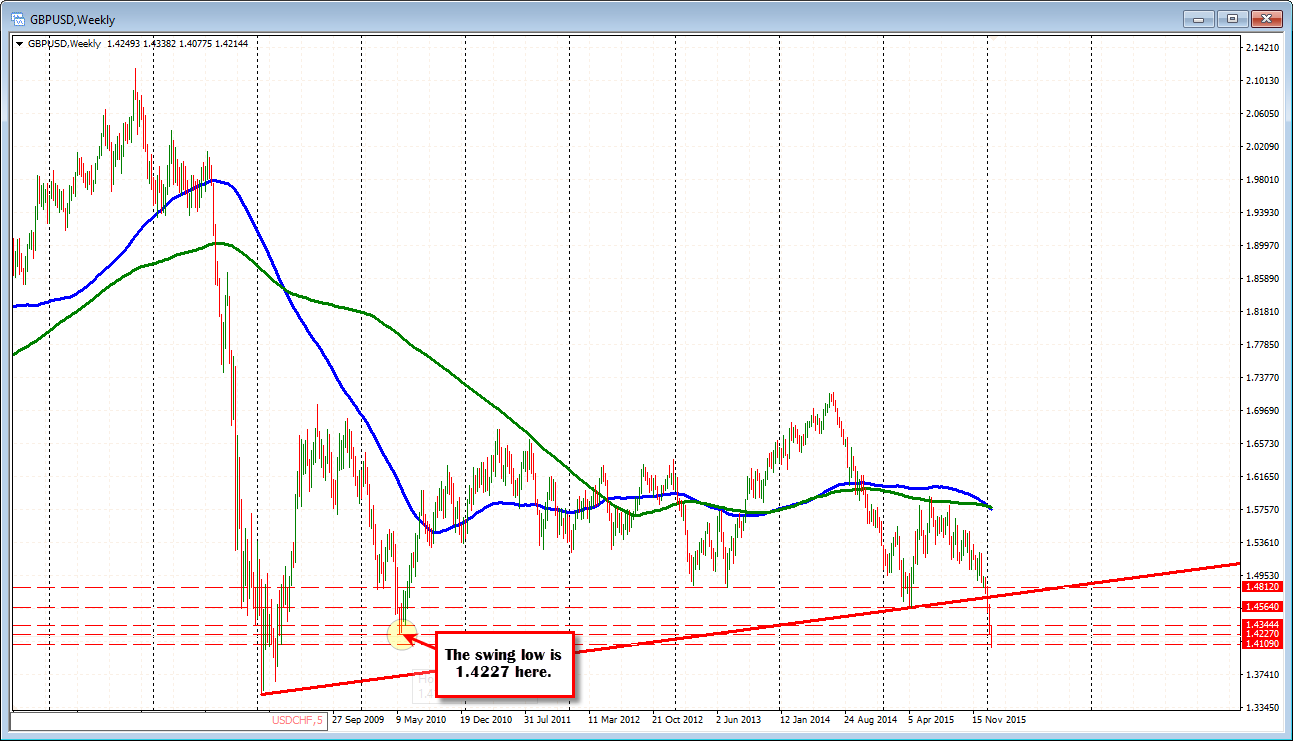
Well, the high just printed 1.4227. Why is that important? If you recall from a few days ago we were talking about that area as a key level. It corresponds with the swing low going all the way back to May 2010. So there should be a battle between that swing low and the 100 hour MA.
What would keep the bottom fishing bulls feeling ok now? Well the close was at 1.4190 yesterday. The pair has been down on a lot of days on the way down from 1.5163 to 1.4077 since Dec 15. An "up day", keeps the buyers happy and hoping for more of a correction. A move above the 1.4227-30 is more bullish.