
...but hourly chart shows some dip buying anyway
The USDCAD rallied to new session highs, traded above 1.3200 for the first time since the end of July and broke a trend line in the process at the 1.3176 level. Yesterday that line was tested and backed off a bit. The rally took the price to 1.3207. However, that break failed and the price started to come down before the DOE weekly data on inventories. That data came out and showed a drawdown in crude stocks (expecting a gain) and the USDCAD fell further.
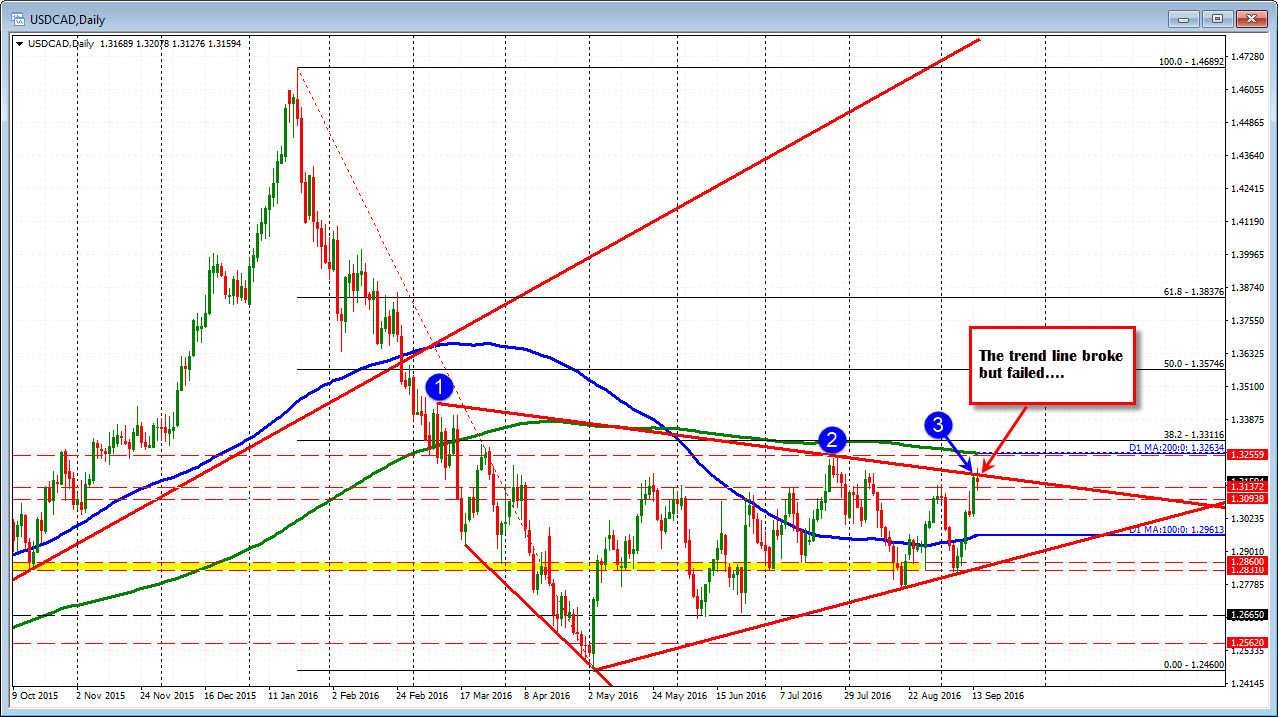
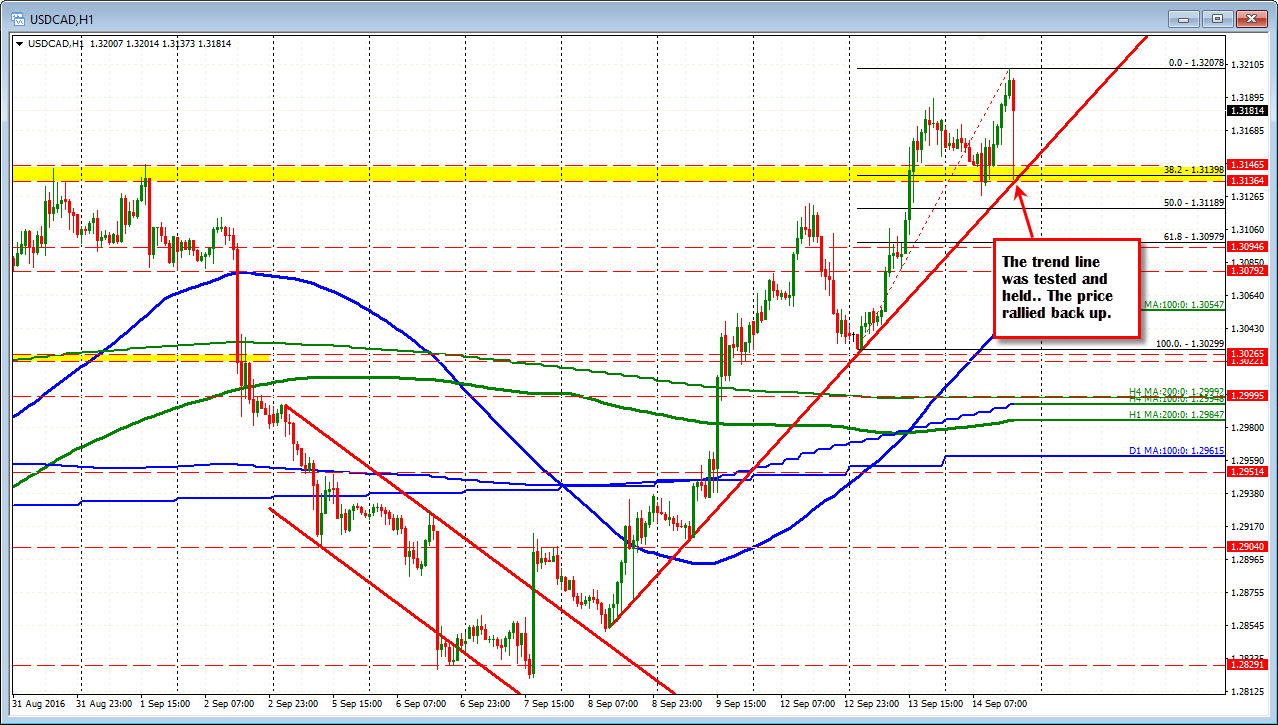
However, that fall has been buffeted by support on the hourly chart (see chart below). That support came against a trend line that has a number of tests and also by prior swing highs going back to the end of August (see yellow area). The 38.2% of the move up from yesterday's low is also in the picture at the 1.31398 level. The price has bounced back above that trend line on the daily chart at the 1.3176 level.
And over in the crude contract?
It is trading at lows for the day (currently at $44.36) after spiking higher on the data (up to $45.59). Tough market. Keep an eye on that 1.3176 level for clues. Stay above more bullish. Move below and we may be in for some chop.

