
IF so, want to see the shorter term bullish clues hold up
The USDJPY has moved up about 40 or so pips from the low ot 100.96 over the last few hours. If the pair is trying to build a rally, I would like to see some of the bullish clues be maintained on the shorter term chart. The price action when combined with risk defining technical levels often don't lie.
So what levels do I want to see hold?
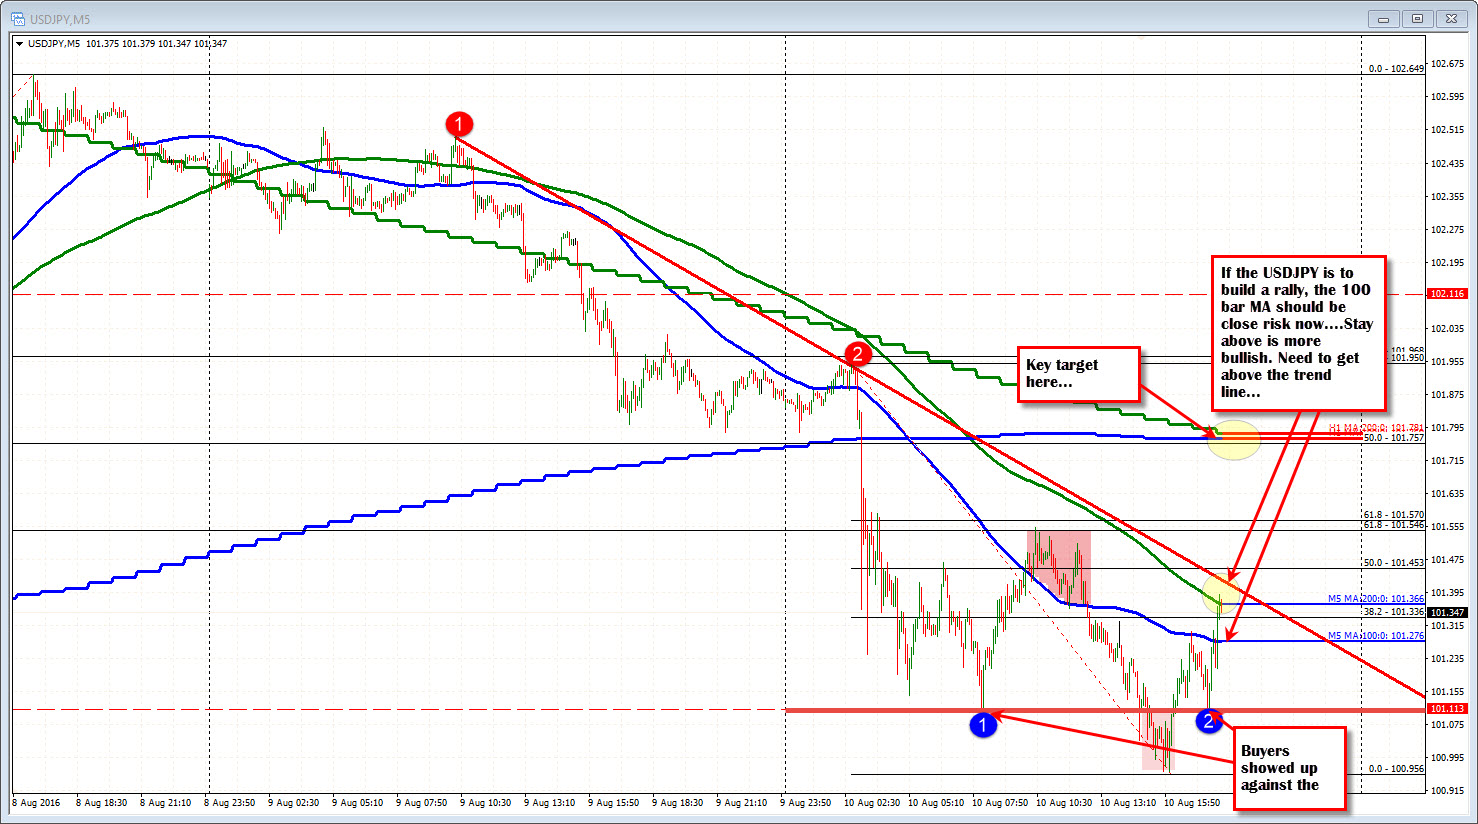
Looking at the 5-minute chart below the pair had a low in the Asia-Pacific session at the 101.11 level. In the early New York session that level was breached our way to the low at 10.956. Since that time the price corrected higher - first stalling at the 100 bar moving average on the five minute chart (blue line on the chart above). The move off that high stalled precisely at the 101.11 level - the low from the Asia-Pacific session.
The 100 bar MA has subsequently been broken and the 200 bar MA tested. That is where we are at now.
From the look of things, there has been some buying interest at the 101.11 level. Stay above that level was more bullish.
The other closer level for clues comes at the 100 bar MA at 101.273 (earlier in the day, there was a move above that MA that failed - see red shaded area). We have moved above that level and tested the 200 bar MA not too far away from it. If the buyers want to make a play for the upside, I would expect them to show up against that level, push the price above the 200 bar MA (green line) and the trend line and start to work on the other upside targets against the 101.57 area and then the 101.75-78 where the 200 hour MA and the 100 hour MA are converged.
If they don't have any intentions for anything more, they will show it on a break below the 101.27 area (give it a few pips).
Are the bulls going to build a rally? Let the technicals tell you the story.

