I have my eye on a few.
Looking at the daily chart of the GBPUSD what do you see?
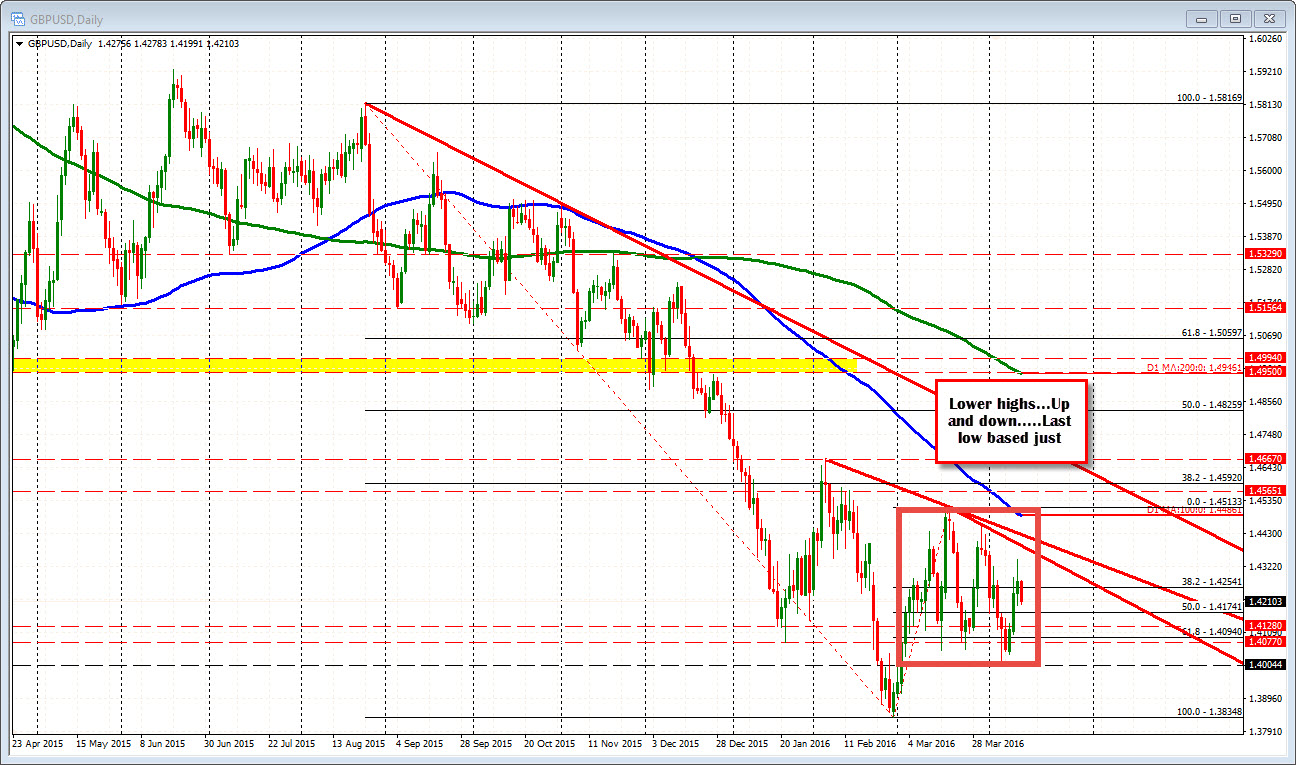
I see a bunch of up and down. The last week stalled at 1.4000 (1.4004 was the low). With today down, the last three highs area lower. The midpoint of the move up from the end of Feb low comes in at 1.4174. There is no trend.
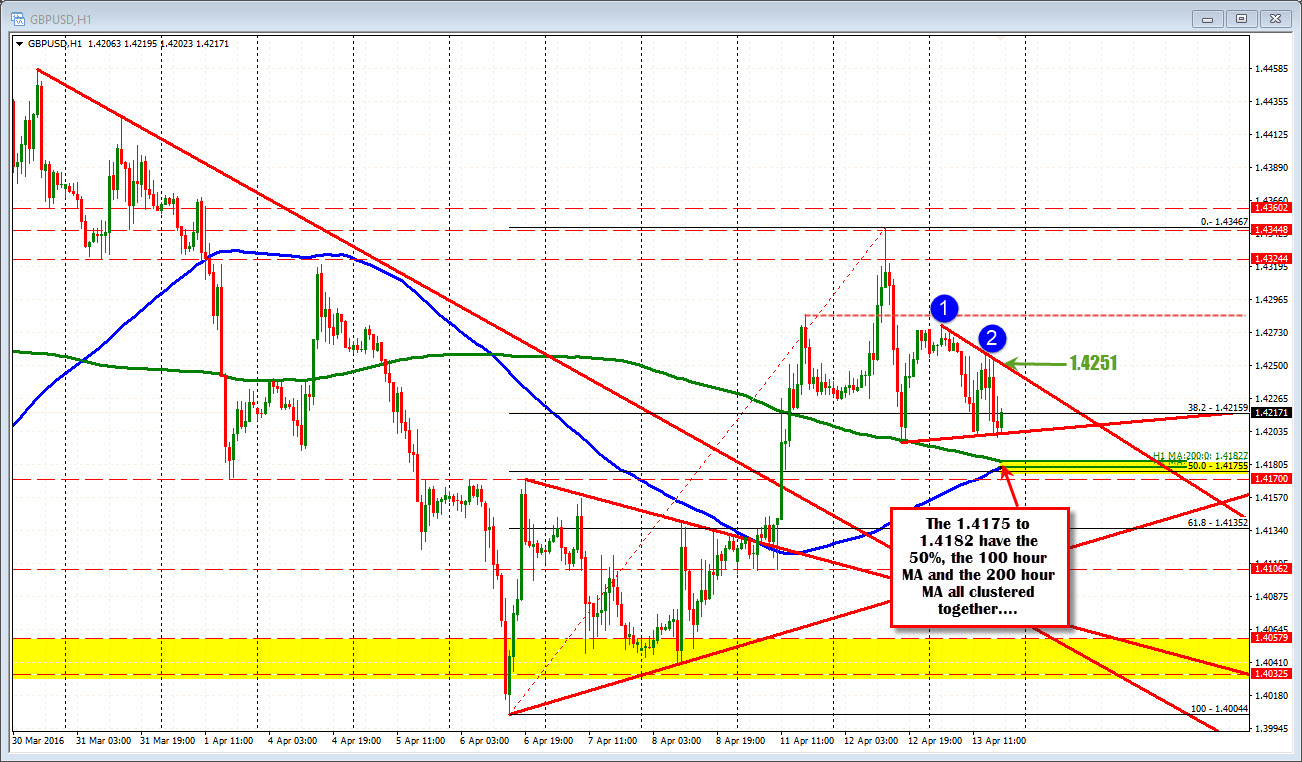
Drilling down to the hourly chart, what do I see there?
Well...the spike higher yesterday failed and the price fell sharply. The low stalled right at the 200 hour MA (green line in the chart below). KEY. Today the 200 hour MA and the 100 hour MA are converging along with the 50% retracement at the 1.4175-82 area. That cluster is a level to expect support on a dip AND stops to be triggered on a break (risk defining level ). If you like the downside, that is the level you want to see broken.
Intraday resistance may well loo at the 1.4251 level now. The high today (and highs off the bounce against the 200 hour MA) stalled below the high from Monday at 1.4286. The highs in trading today are lower. So the sellers are more in control....a little. If the 1.4251 level can hold on a correction (or lows broken), that big test against support will be the deciding vote on what happens next for this pair....