Trades to new session highs, but backs off.
Redoing of NAFTA has the USDMXN trading higher (MXN lower).
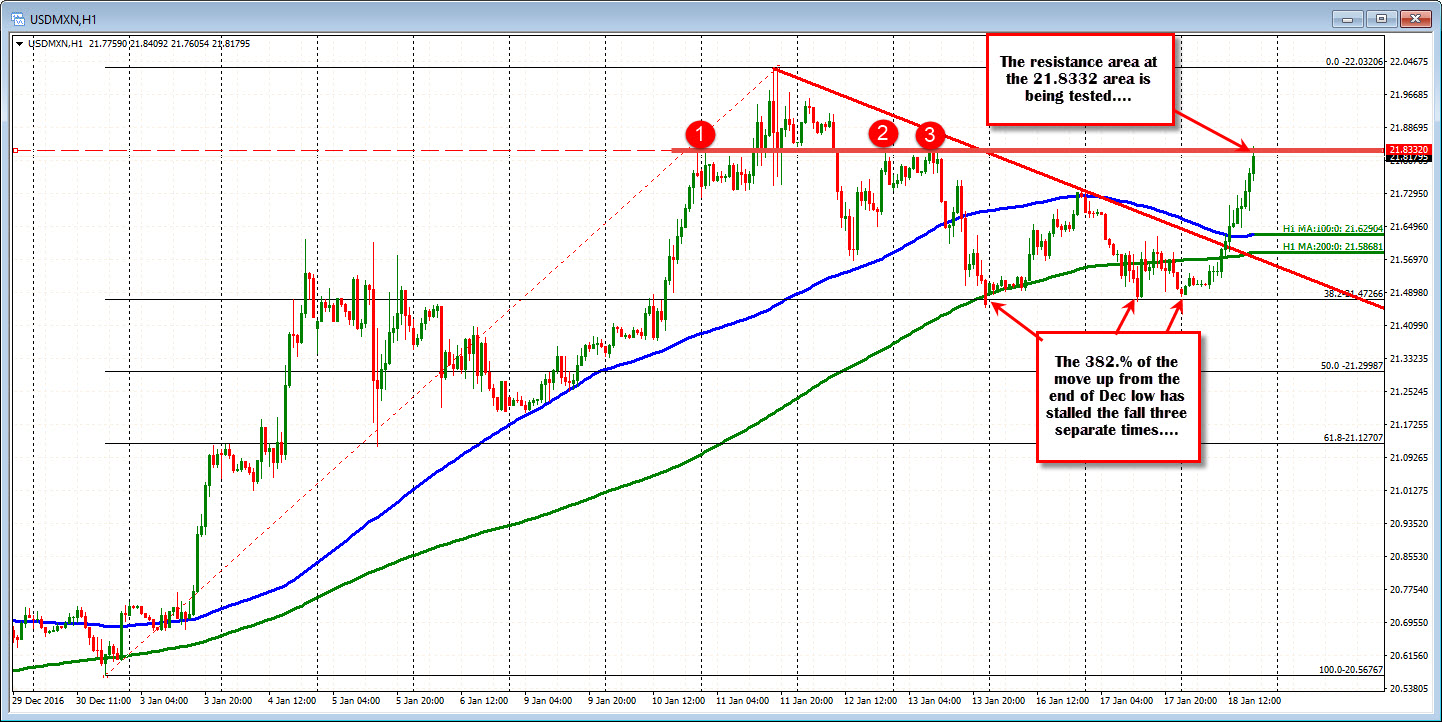
The pair yesterday found support against the 38.2% of the move up from the end of December low. That level comes in at 21.47257 and the low yesterday 21.4685. Close enough for this pair. Traders were leaning (see post from yesterday). That was more bullish.
The push higher today has seen some further moves above technical levels which has increased bullishness for the pair. Looking at the hourly chart above, the price has moved back above the
- Downward sloping trend line,
- 200 hour MA (green line currently at 21.5867), and the
- 100 hour MA (blue line at 21.6289 currently
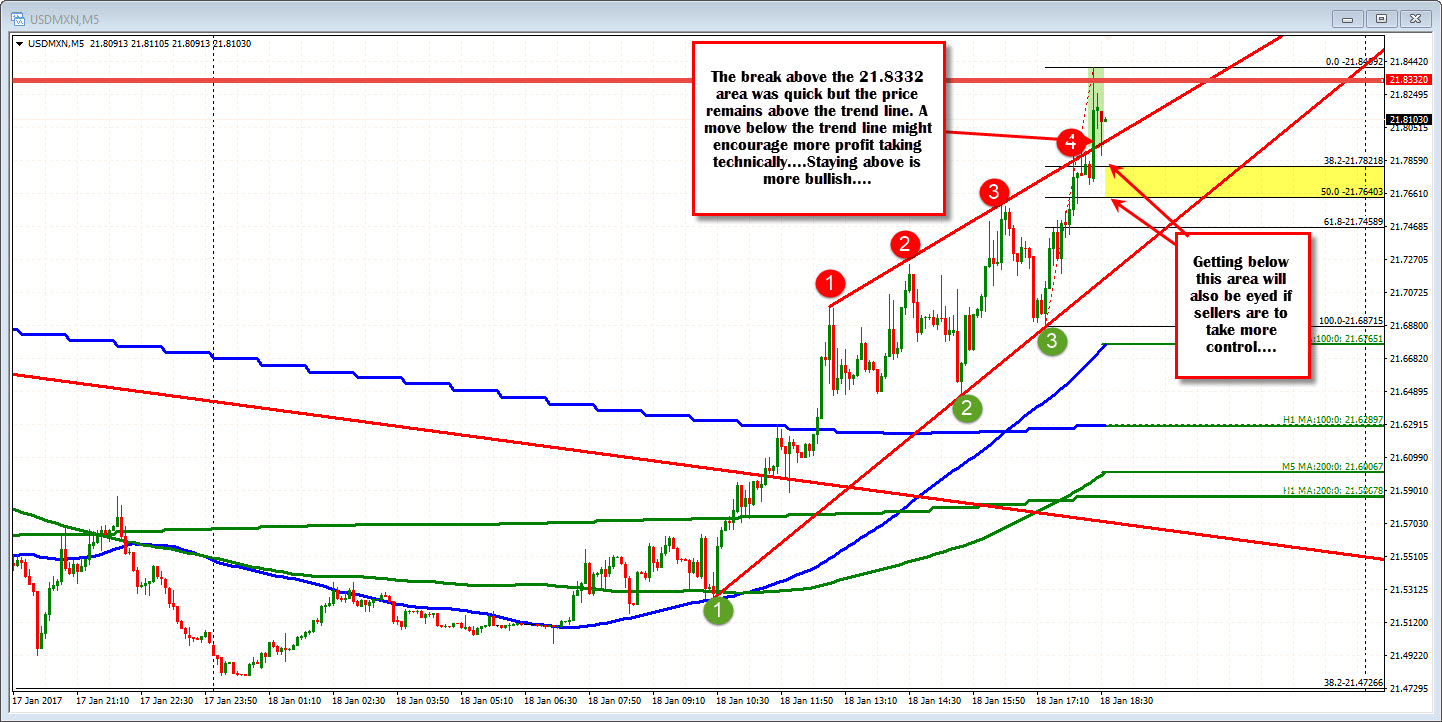
The day's highs just moved above a resistance area at the 21.8332 level. Swing highs stalled near that area going back to Jan 10/11 (also on Jan 12 and Jan 13). The high reached 21.8409, but we are quickly back below that level. Profit takers? Looks like it.
Drilling down to the 5-minute chart, the price peak extended above a topside trend line - accelerating the trend higher in the process (more bullish above the line). The price has moved back toward that topside line and is finding buyers. Nevertheless, watch the rebound and the 21.8332 area. If buyers can not push back above that level and the price moves back below the topside trend line, we could see some additional profit taking. Right now, however, the break is holding. It is a matter of getting and staying above the resistance level near the highs for the day.