
Looks toward a test of the 100 day MA at 103.73
The USDJPY has surged after the better I send nonmanufacturing and factory order data out of the US.
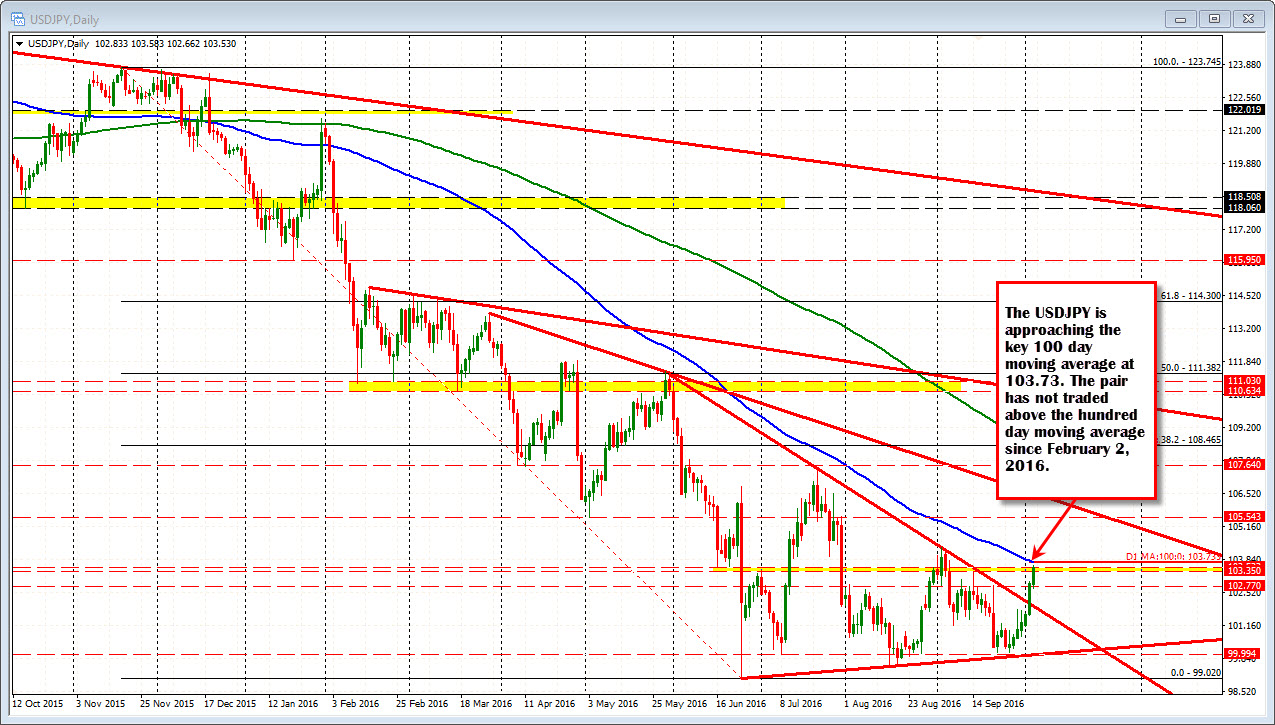
Technically, the pair is approaching the 100 day moving average which currently comes in at 103.733. The price of the USDJPY has not been above the 100 day moving average since February 2, 2016 when it broke at the 120.59 level.
In the move higher, the price has moved above the 103.35-53 area (see yellow area near the bottom of the chart above). That level corresponds with swing highs and lows going back to mid-June 2016. That area should now act as support (down to 103.35).
Should the upside momentum continue today, the first test of the 100 day moving average should attract sellers simply because of its importance in the time since last break. However, with the pairs break above trendline resistance yesterday, the inability of the USDJPY to make the expected move below the parity level, and the sharp decline in 2016 (the high was way up at 121.60 area), there is room to roam should the dollar bullishness become more rooted. Look for a test to perhaps retrace, but I would expect that buyers would be lurking on moves lower.
On a move above the 100 day moving average,
- the high from August 2nd at 104.31 becomes the next target.
- Above that and 105.23 (50% of the move down from the end of May high - not shown), and
- 105.54 (swing low from May 3rd) become targets.
Support at 105.35. Resistance at the 100 day MA. That is how I see it from here.

