
Hanging above the support level but not going far
The USDJPY has a couple of key events that increase volatility and risk dependent on how they go.
- FOMC statement
- BOJ decision
There are a lot of different scenarios that make the trading decision more of a gamble. The indications from the BOJ are for the potential for more stimulus. For the Fed, they are supposed to be looking to tighten in 2016. They are not going to do it today but what about June? That will be the key takeaway from that meeting.
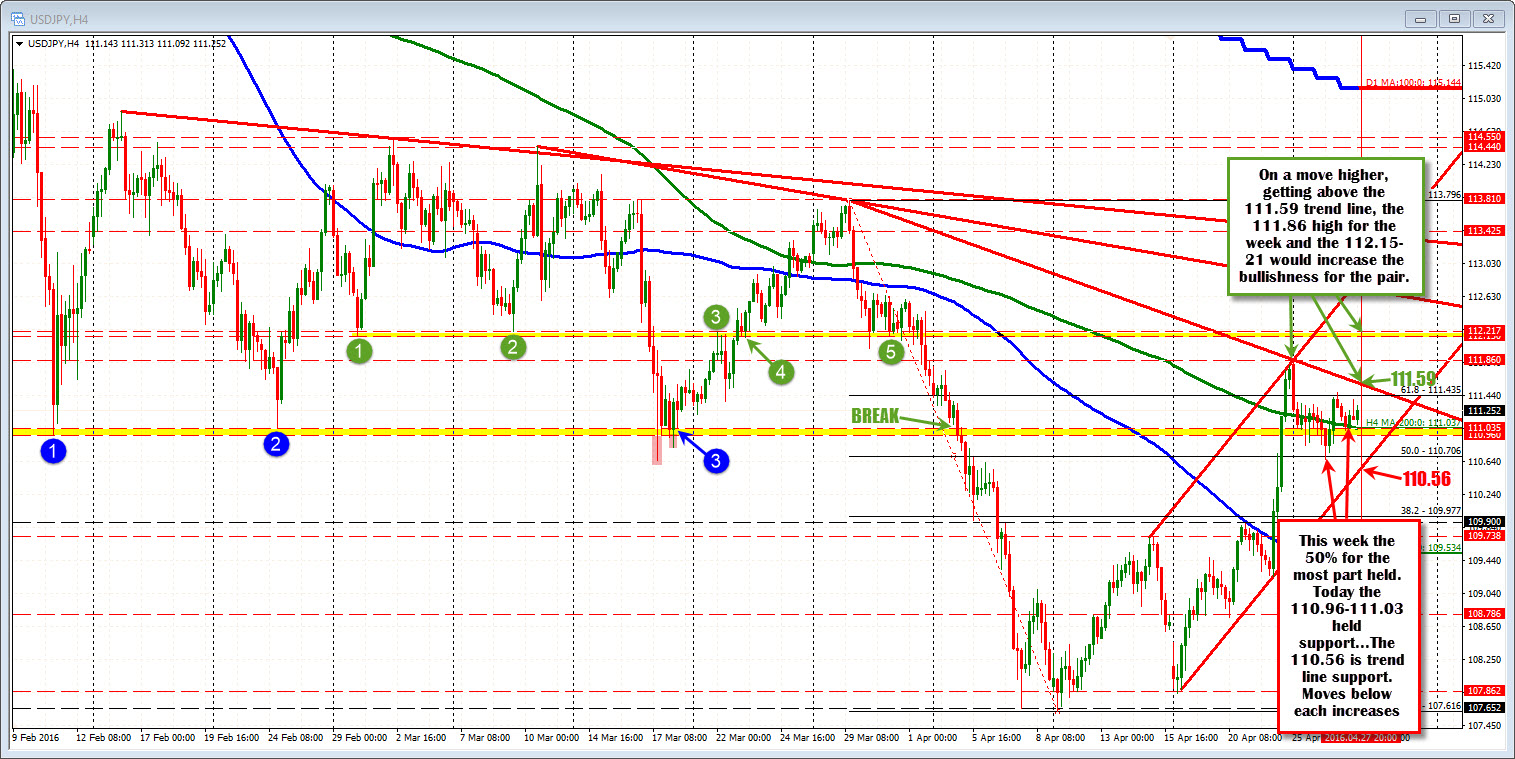
Technically, the pair is a touch more bullish. Why?
- The price moved above the 50% of the move down from the March 29th swing high. that level comes in at 110.706. The low this week bottomed just below the midpoint line at 110.66. So buyers keeping control
- The price is above what was a swing support area going back to February. That area is above and below 111.00 (give or take a few pips on either side). ON Feb 11 (blue circle 1) thethe swing low was 110.96. The price bounced to 114.86. The next swing low on Feb 24 (blue circle 2) stalled at 111.03 - just above the 110.96 prior low. The bounce off that low reached 114.55. Then on March 17/18, the price did break below those lows but the lowest close was 111.02. This week, the price has traded above and below the 111.00 level as the market consolidates before the decisions. However today the low came in at 111.02. So buyers bought against the area. That is more bullish.
- The 200 bar MA on the 4 hour chart comes in at 111.03 currently. The price is above that level.
Those are the little bullish nuances from a technical perspective. Does it mean we are green lights to the upside? No. The market has been wrong before. A Fed that does not change their stance could be enough to send the pair back lower on disappointment. So there is no guarantee.
We know a more hawkish Fed and/or more dovish BOJ would be bullish. We don't know if that is what will happen.
So if you want to sit this dance out and trade after the fact, you won't be alone. Risk is elevated.
What if you have a position and like your bias, what would change your mind from a technical perspective? Alternatively, what if you wanted to trader after the news is out, what technical levels would increase the bullish or bearish bias?
Typically, traders will look at what they want to happen that would give them a reward. For me, I would be more concerned about what I don't want to happen. That comes from defining bullish or bearish from technical tools. So what DON'T I want to see technically happen from both a bullish and bearish perspective?
What don't I want to happen if bullish?
Clearly, with the price currently trading at 111.29, the thing I don't want to happen is for the price to trade below the 110.96 and then the 50% retracement at the 110.706. A move below both those technical levels will push the technicals more negative/bearish. If you want to risk to the lower trend line, that line will cut across at the 110.56 level at 2 PM (see chart above). A move below each of those three levels and the bias will get progressively more bearish on each step.
What I don't want to happen if bearish?
If you are dovish the Fed and don't think the BOJ will ease further, you would not want to see the price move above the topside trend line connecting highs from March 29 and April 25th. That line cuts across at 111.59. A move above would next target the 111.86 high for the week. A move above those levels will look next toward 112.15-21. Those levels were swing lows from March 1st and March 9th. On March 30 and April 1st the pair traded around those levels as well, before pushing lower. Like the levels on the downside, moves above each of these upside technical targets, would turn the bias progressively more bullish.
Those are the levels in play. If you want to trade after the fact, look to use the levels as entry levels on breaks. You would then want to see those levels hold should there be corrections.

