But break is contained...
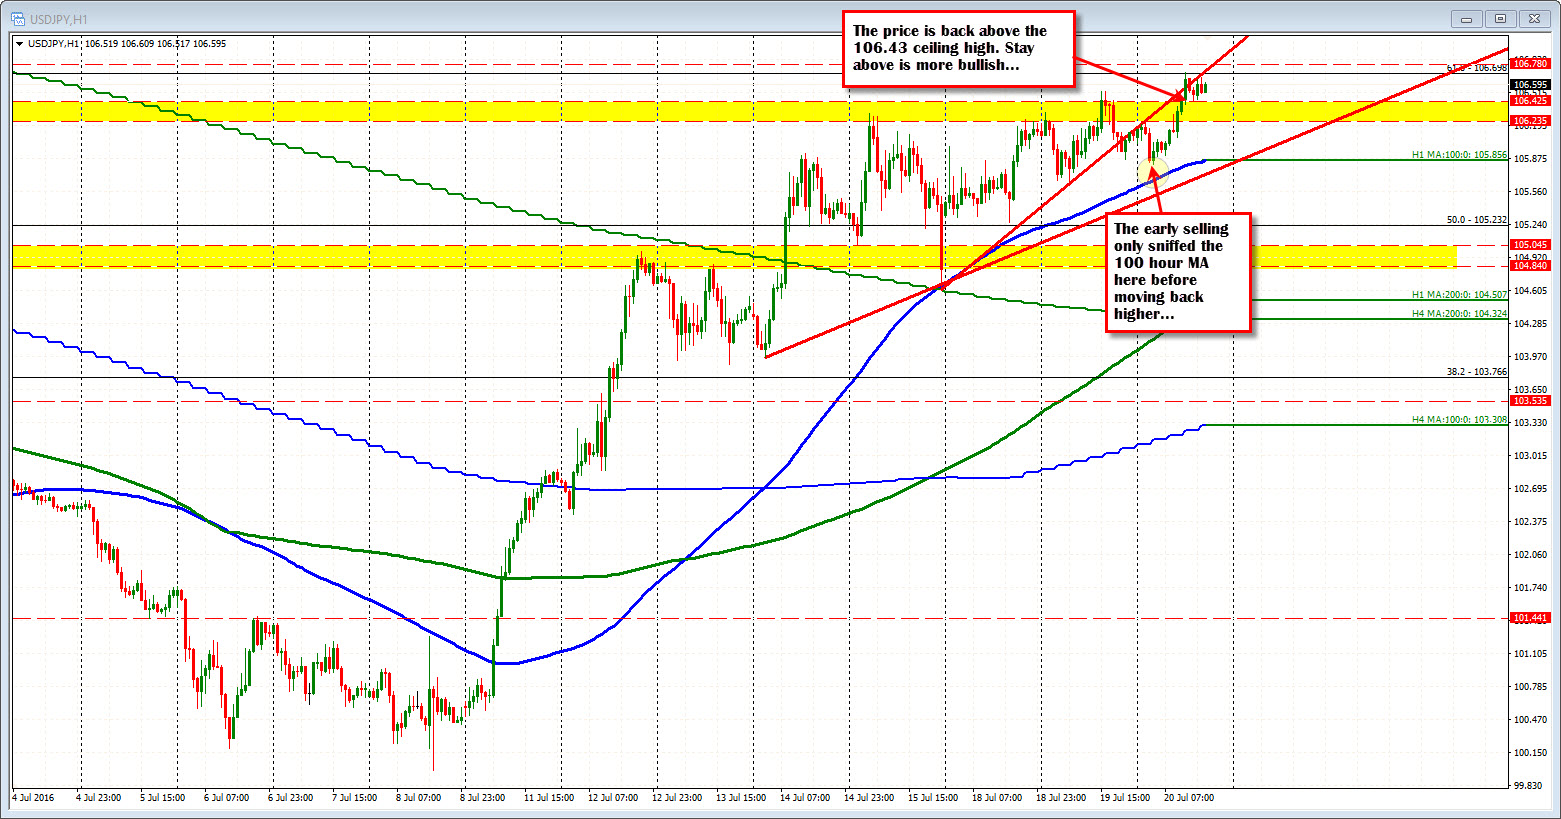
Yesterday at the close the USDJPY was falling below trend line support (see chart below). The 100 hour MA (blue line in the hourly chart) was coming closer to the price. The Asian Pacific session saw the price move lower initially, but it only sniffed the 100 hour MA (blue line in the chart below), before moving back higher. A recovering stock market helped the bias turn around.
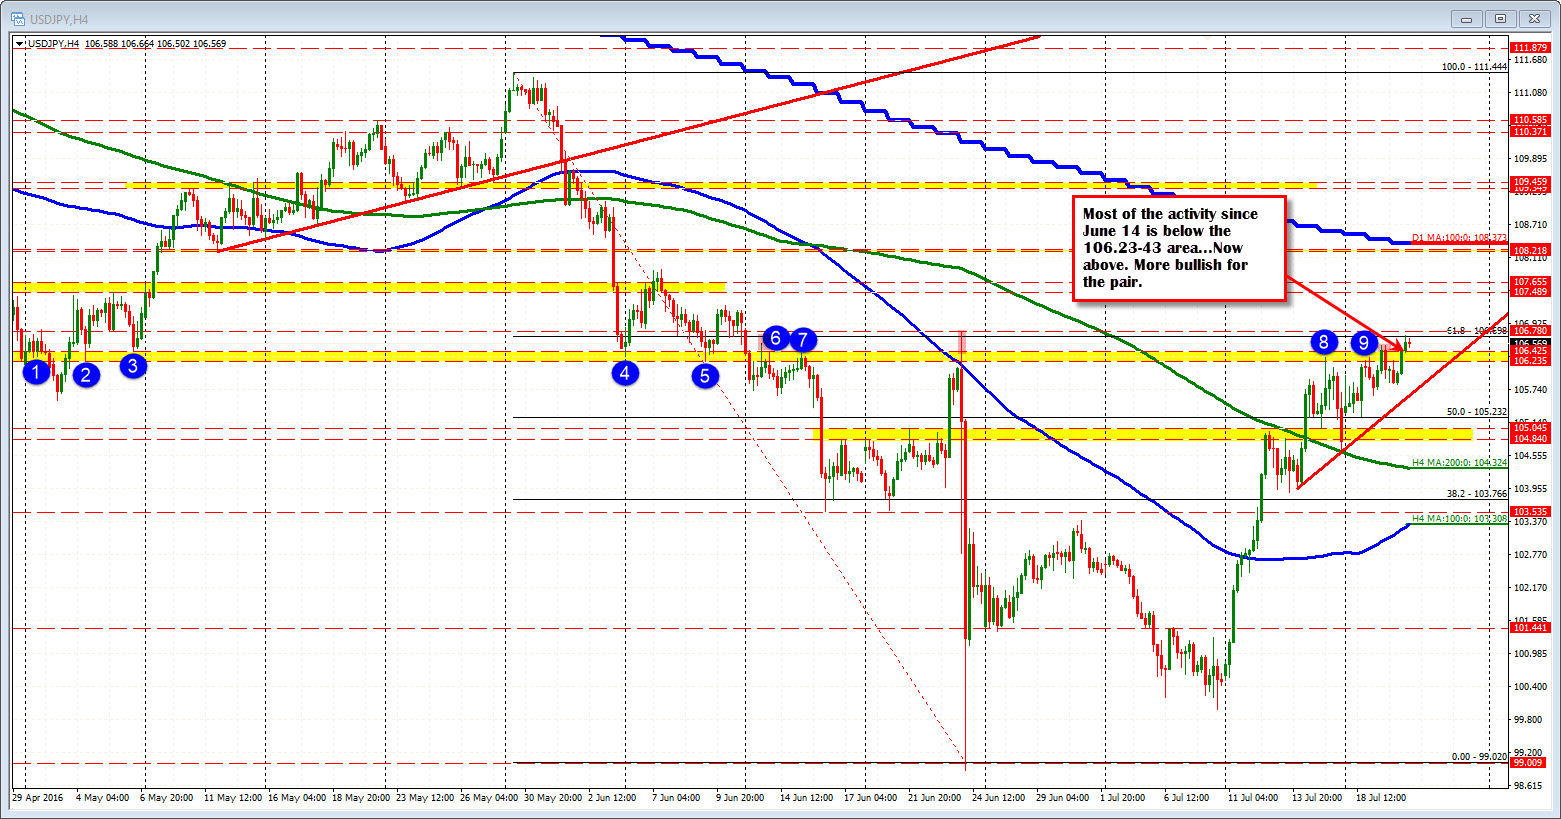
That move higher has taken the price back above the 106.23-43 area. Looking at the 4-hour chart, that area has defined a bullish and bearish line going back to May. Around mid-June the price fell below that area and apart from a spike higher on Brexit day, the price has stayed below (see chart below).
The move higher - and move above the 200 bar MA on the 4-hour chart last week (green line in the chart below) - gave traders the go ahead to test the yellow area. The Turkey coup on Friday, sent the pair down to test that 200 bar MA, but stalled.
This week on Monday, we opened higher (coup failed) and slowly the price has moved toward that resistance ceiling once again.
Today - the last 6 hours - has seen the price move above 106.43 and stay above that level. Staying above is more bullish. A move back below and the buyers may abandon ship (at least a little). Now however, the tilt stays bullish with an increased bullish bias with the price action today (and the technical break).