
Reacting to equities
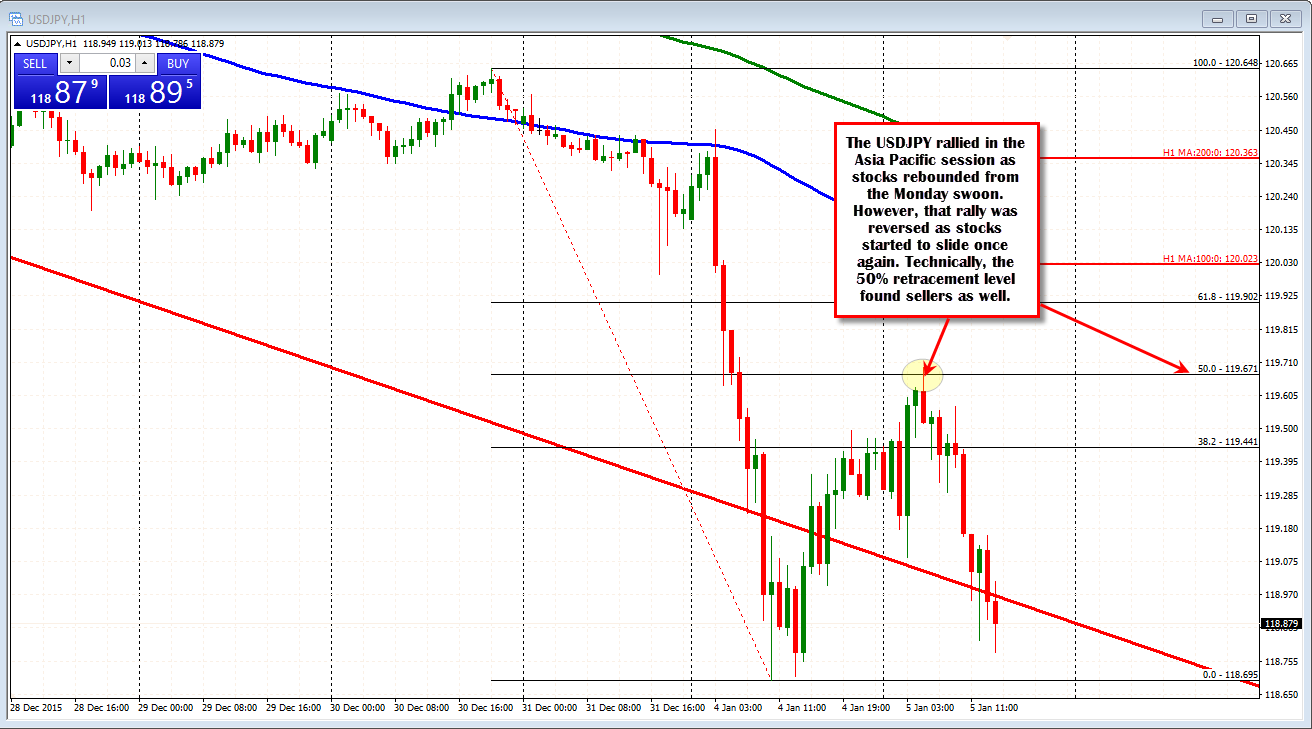
The USDJPY seems to be the currency of choice as long as equities are declining. That has been the pattern of late at least. In the Asia-Pacific session, the major indices were higher on the day. The Shanghai composite index - which was down 6.8% on the first day of the year - was positive as was the Nikkei. That helped the USDJPY rise. However, that rally stalled at the 50% retracement of the move down from the Dec 30 high ( see chart below) and a reversing stock market, has led to the pair moving back down.
What now?
Well sellers are more in control. The action on the hourly chart with the sharp decline yesterday, the correction to the 50% and the pair near session lows point in that direction. The pair does have the lows from yesterday as targets.
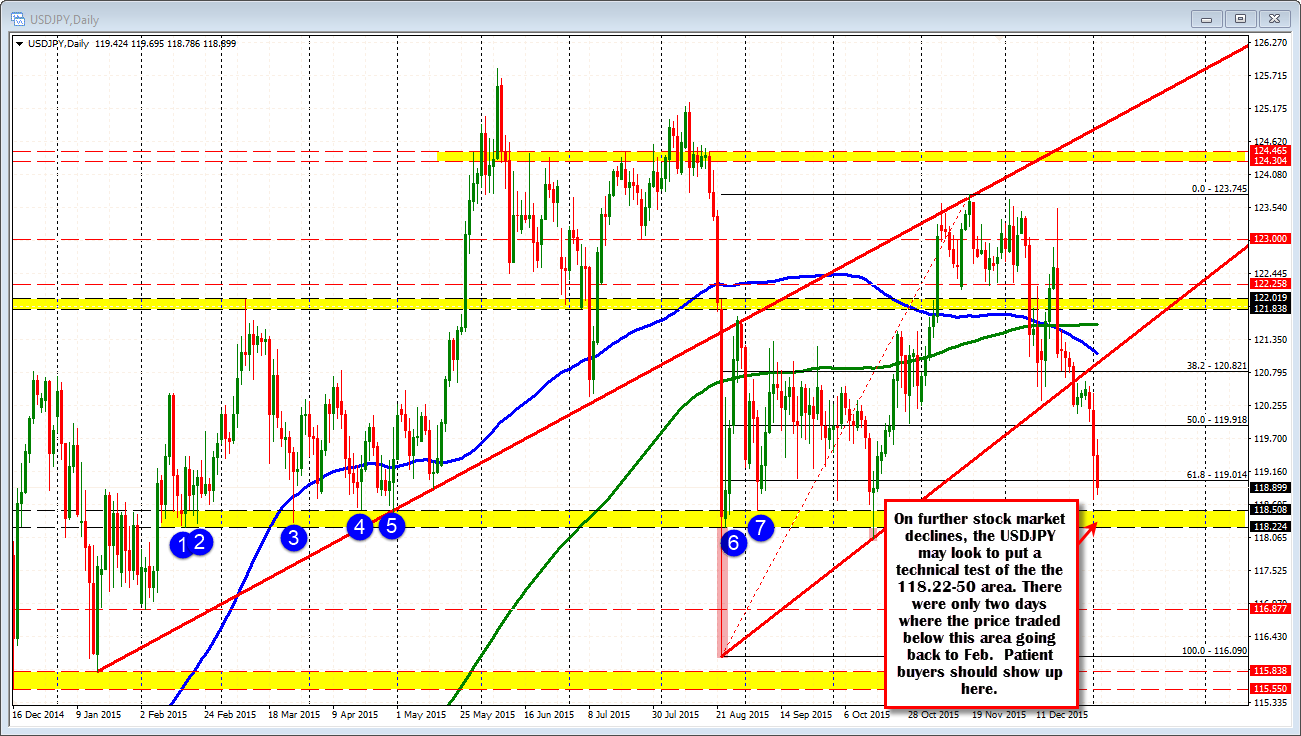
Looking at the daily chart, the pair is approaching an area that has been a key floor for the pair going back to February 2015. That area comes in at 118.22-50. Apart from 2 days, the price of the USDJPY has traded above this area since Feb 2015. The two days below did not close below the area. There were a number of swing lows that bottomed in this area (see blue circles). If the price for the pair has a lower target from a technical perspective where buyers would look to buy, this should provide support. That trade will likely need to see further stock weakness today.
Drilling down to the 5-minute chart, it is showing that the road to those lower levels is finding interim support from yesterday's lows and a lower trend line (see chart below). The market traders seem to be trading a range with risk defined below putting a floor in place. On a correction there should be resistance sellers near the 119.13-24 area (38.2-50%). The 100 and 200 bar MAs are in this area (or moving toward it as well).
Overall, the sellers are in more control, but with US stocks yet to open and support tested, the dip buyers have their voice as well. Trade the levels.

