US stocks trading at session highs
The US stock market is trading at the session highs for the S&P and Nasdaq, and so is the USDJPY.
Is it the US data? It was mixed. If I were to guess I would say that the GDP estimates will be racheted lower. The chance for a Fed hike in September is going lower vs higher. The same for December.

Is it expectations for more BOJ stimulus (see Adam's post for a fundamental view of the BOJ and the impact on the USDJPY)? Perhaps. "Just buy dips and see where it goes" may be the story line.
Technically, the hourly chart is not all that pretty - especially the price action today. The price moved higher and lower and higher and lower (on the initial reaction to the US data). We are now making new highs. Is it running? No. We are above the 100 and 200 hour MAs at the 102.36. If something can be gleamed from the hourly chart, that is what I see (but it is still shaky).
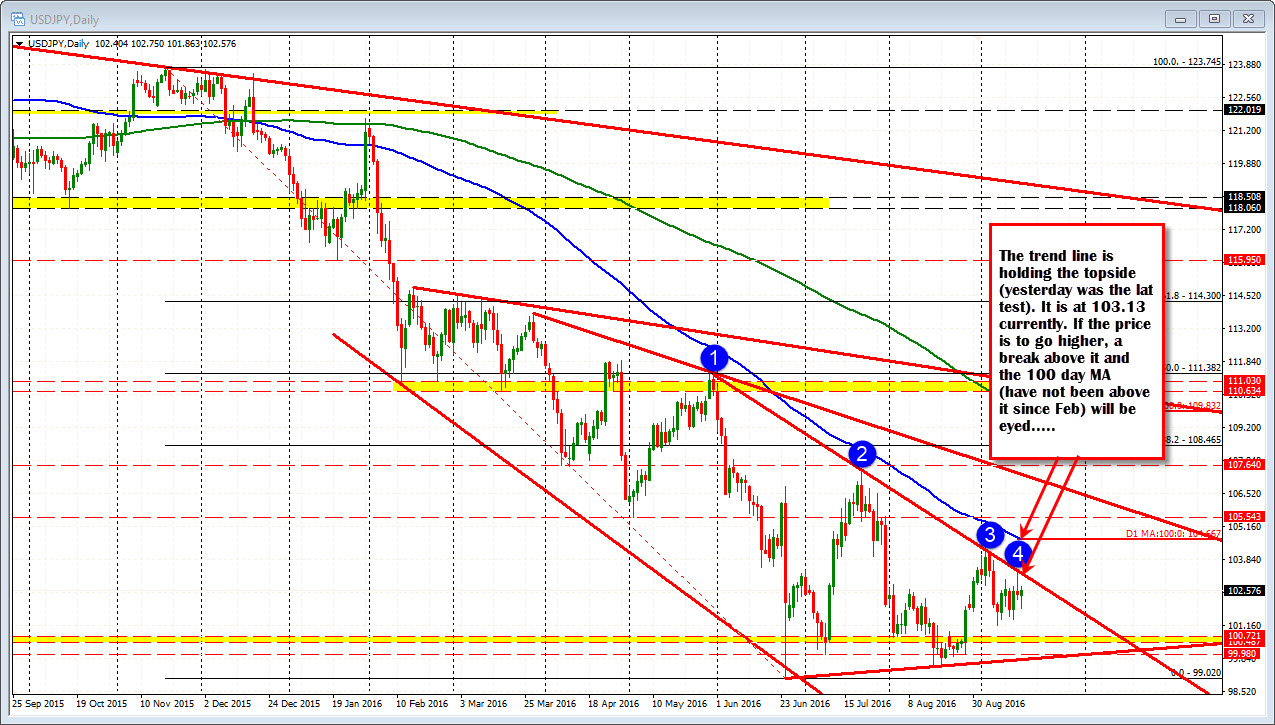
Looking at the bigger picture from the perspective of the daily chart, the market over the last 7 trading days is not doing much. The price is up and down with green and red bars.
What is clear to me from that chart, however, is that trend line that connects recent highs (see blue circles in the chart below). We are still below that line. Yesterday, the line was tested and the sellers pushed the price back down.
The level for that line comes in at 103.13 today. If down the road the BOJ or rising stocks (or whatever) is going to change what has been a more bearish bias for the USDJPY to something more bullish, that line has to be broken followed by the 100 day MA (blue line in the chart below) at the 104.66 level currently, to turn the tide around for this pair.
So support at the 102.366 today and a vision for a break of the 103.13 level above for more bullish potential. If that story line cannot be written, the big bad bears (or big good bears) remain in control.