Trade data out at 2350 GMT
The USDJPY has moved a touch higher in early week trading.
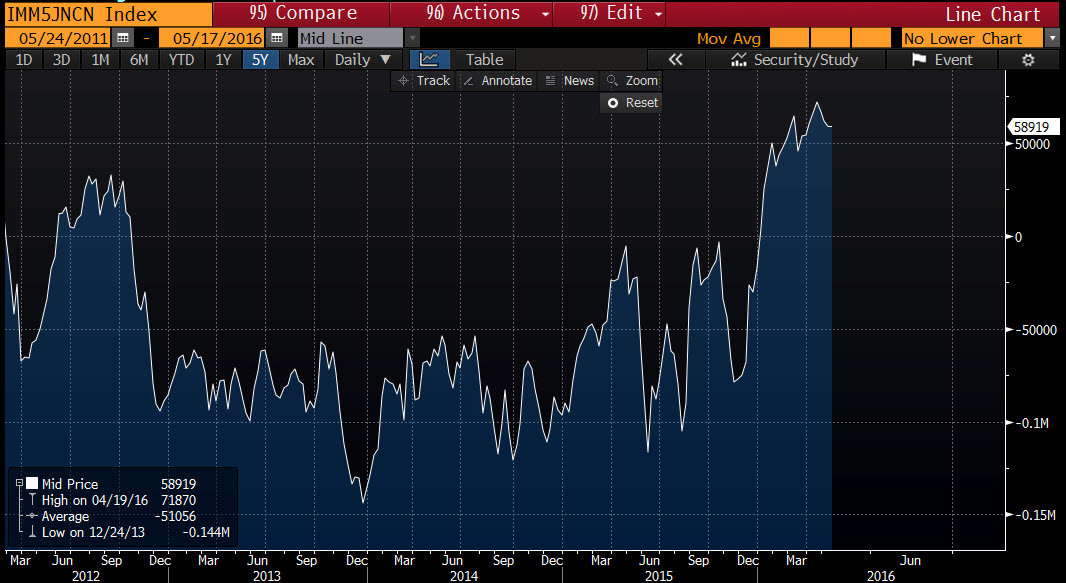
Over the weekend Japan's FM Aso expressed concerns about the speculation in the JPY and the sharp move higher from the mid February level at 114.868. The CME's futures commitment of traders report has seen a rise in long JPY positions from lower levels at the end of 2015. This is indicative of what Aso was saying. So he may have had a point. Of course, most economists had expected more monetary stimulus - which has not happened. The last push to the lows on May 3rd, was helped by BOJ which was less dovish than the market expected.
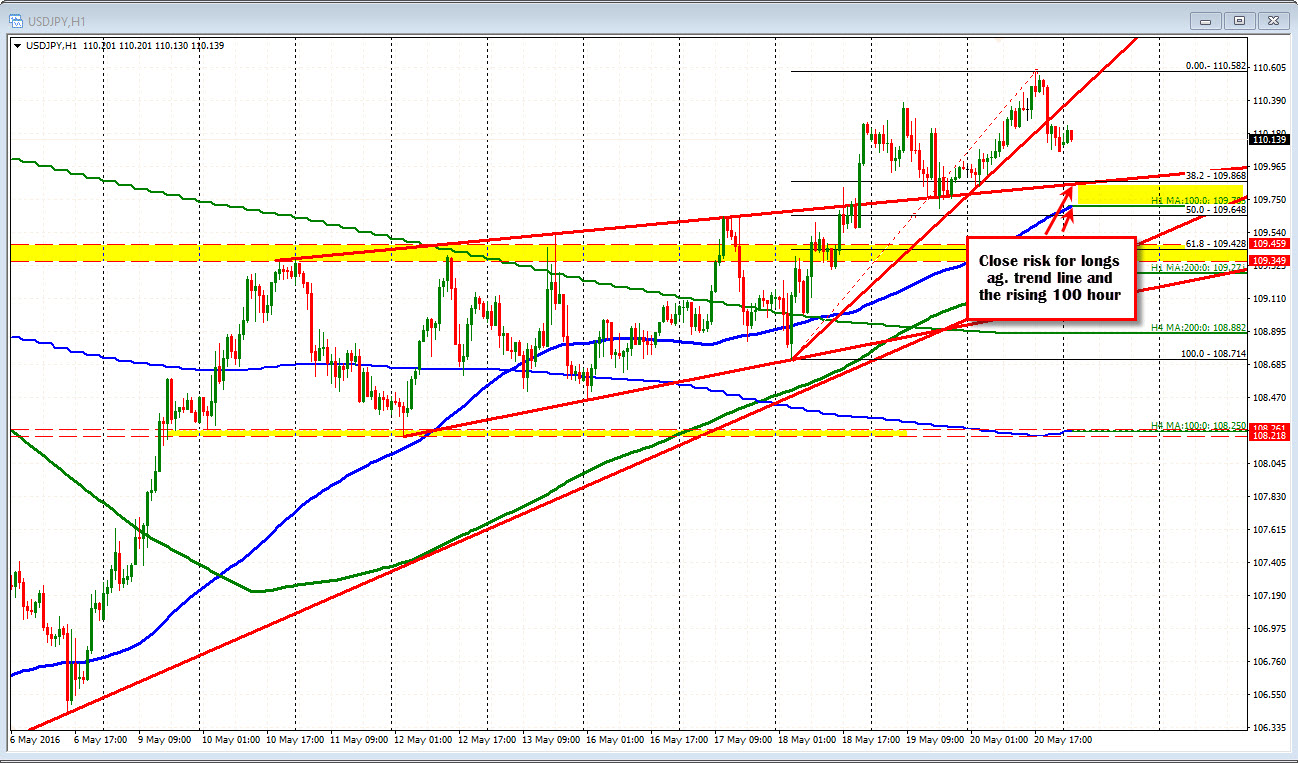
Anyway, technicallly, from the March high to the April low, the pair has retraced 50% of the move lower. That level comes in at 110.20 and the pair trades at 110.16 currently.
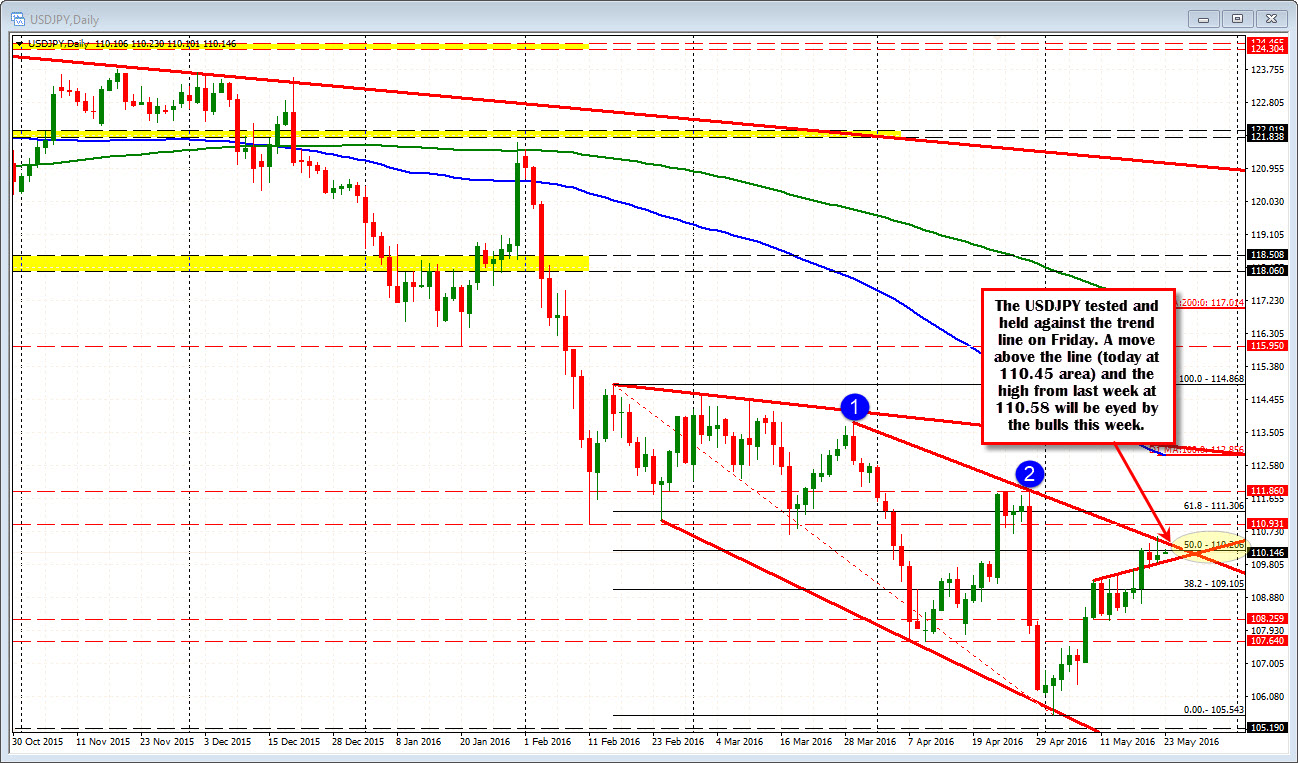
Last week, the price peaked near topside trend line resistance (the trend line cut across at 110.54ish level. The high reached 110.58). The pair came off at the end of the NY trading day on the back of a Nikkei article that said the BOJ was stockpiling reserves for a potential ending of QE (that was speculation). That helped send the USDJPY lower into the NY close for the day and the week.
ON the US side of the equation, Fed's Rosengren was a bit more hawkish over the weekend and pointed out that the hurdles the Fed has set, are really not that great. That should be supportive.
Technically. if Aso is going to start getting his way, getting above the 50% would be step one. Next will be a break above the trend line that stalled the pair on Friday. That line cuts across at a lower level today (at 110.45ish). A move above last weeks high at 110.58 would also be eyed to increase the upside potential for the pair.
Looking at the hourly chart, the pair had a nice slightly positively sloped trend line, that was broken on Wednesday, tested on Thursday before moving higher on Friday. The late day correction on Friday took the price below a steeper trend line off the week lows (see hourly chart below).
The lower/flatter trend line I see as support/risk for longs here. That comes in at 109.86. The 100 hour MA is working it's way up toward that line. It currently is at 109.71 and moving higher. On dips, look for support against the trend line on the first look. A break below will be eyed for further downside momentum.
I give the longs a little bit of the nod, but if this pair is going higher, it has to start showing it can take out overhead resistance. If the close support levels give way on the downside, those buyers who have pushed higher, may give up and sell.