Staying below 100 and 200 day MA will be eyed.
The USDJPY trended lower yesterday - falling back below the 100 and 200 day moving averages (blue and green line in the chart below). Those levels come in at 121. 66 and 121.57 respectively.
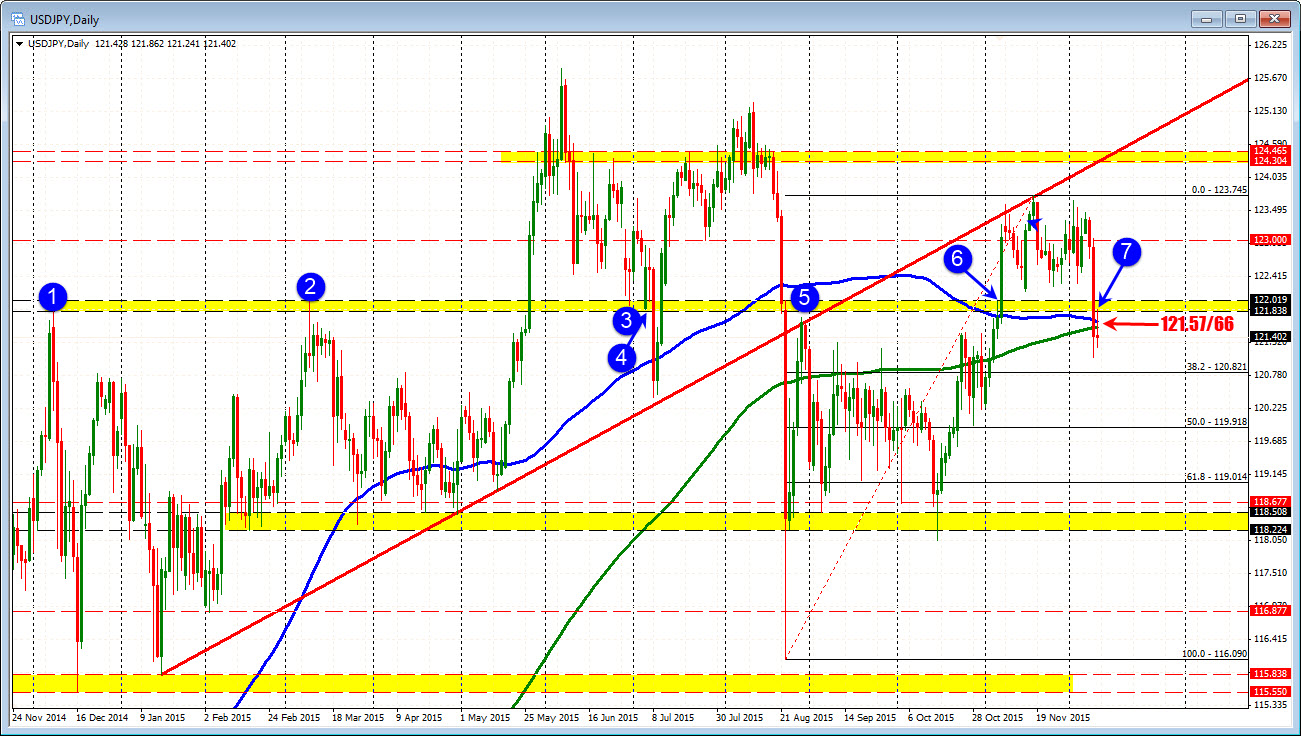
The pair today has been up and down. The correction higher extended above the two key MAs but held resistance in a ceiling area defined by a number of swing lows and swing highs going back to December 2014. That area comes in between 121.838 and 122.01. The high reached 121.862. The fall from that corrective high has taken the price back below the 100 and 200 day MAs.
What now?
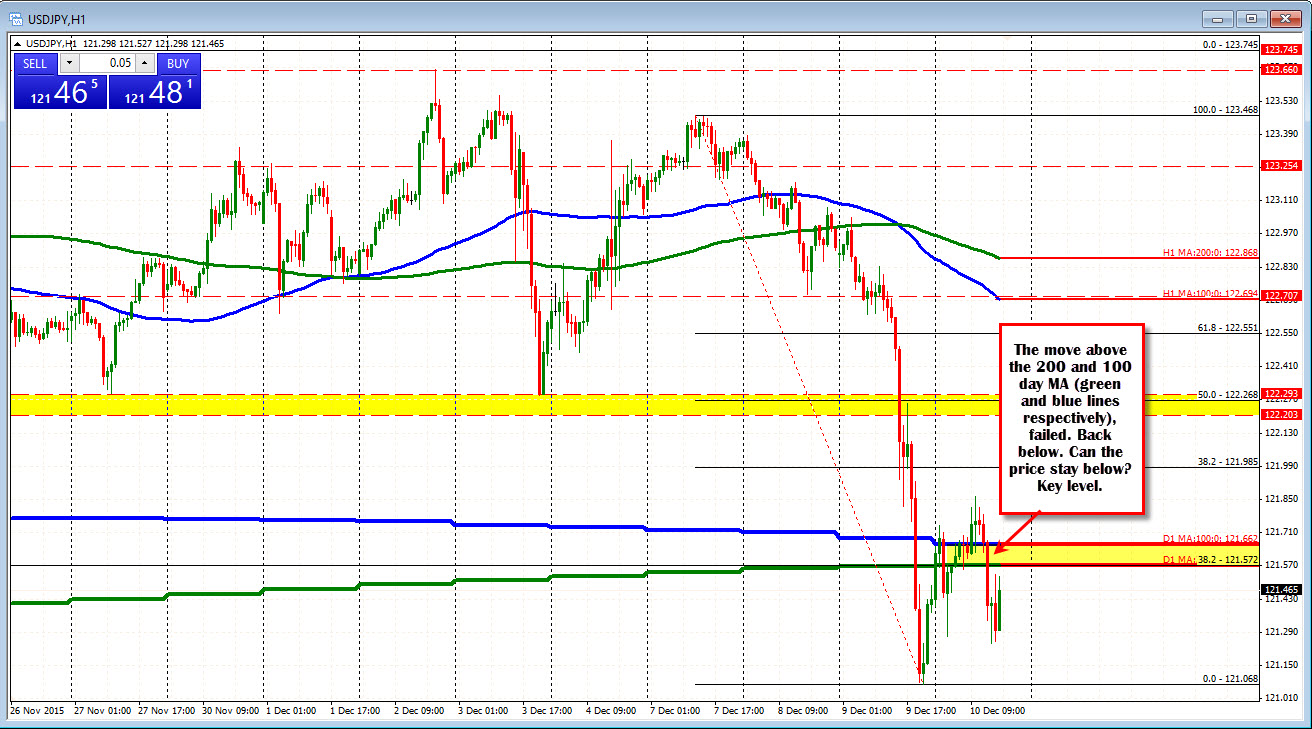
Technically I cannot ignore the fall back below the 100 and 200 day MA. Looking at the hourly chart the pair is holding below the level over the last few hours. Troubling is a new low was made for the day with no momentum though. So from a trading stand point we could be in for continued up and downs. Nevertheless, those two moving averages make for a level trades should use to their risk defining (and bias) advantage. Move above is more bullish. Stay below more bearish.
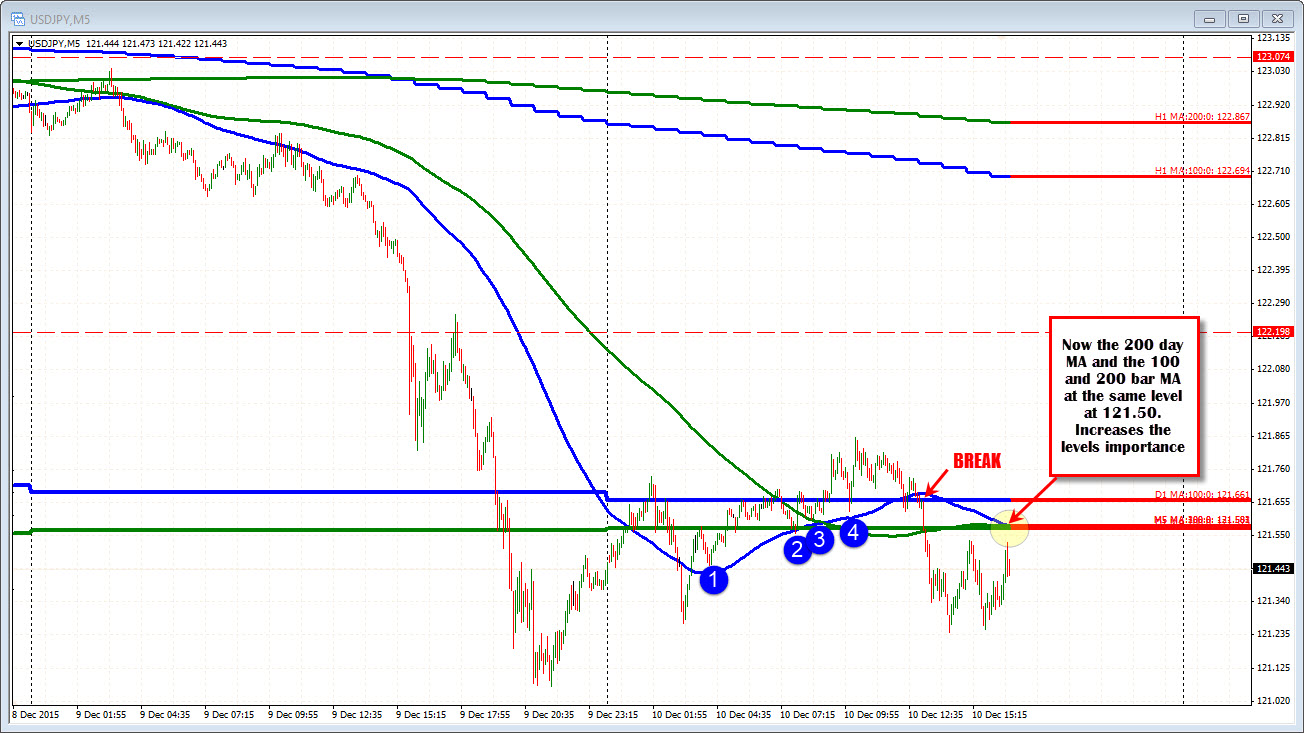
Anything on the 5-minute chart worth noting (what are the intraday scalpers doing).
The pair has weaved above and below the 100 and 200 bar MA. They are now converged at the same level as the 200 day MA. So that level is significant for other reasons on this chart.