
What are the levels to eye
The BOJ decision and half-year forecast will be announced in the new trading day, and markets have taken the JPY pairs higher in anticipation(?) of more stimulus (a more hawkish Fed is also contributing). The market analysts are divided with 16 of 36 analysts at a Bloomberg survey expecting more easing, 8 seeing more stimulus but at a later date, and the balance not seeing any change in the future.
Such predictions increase risk and also increase the chance for a break.
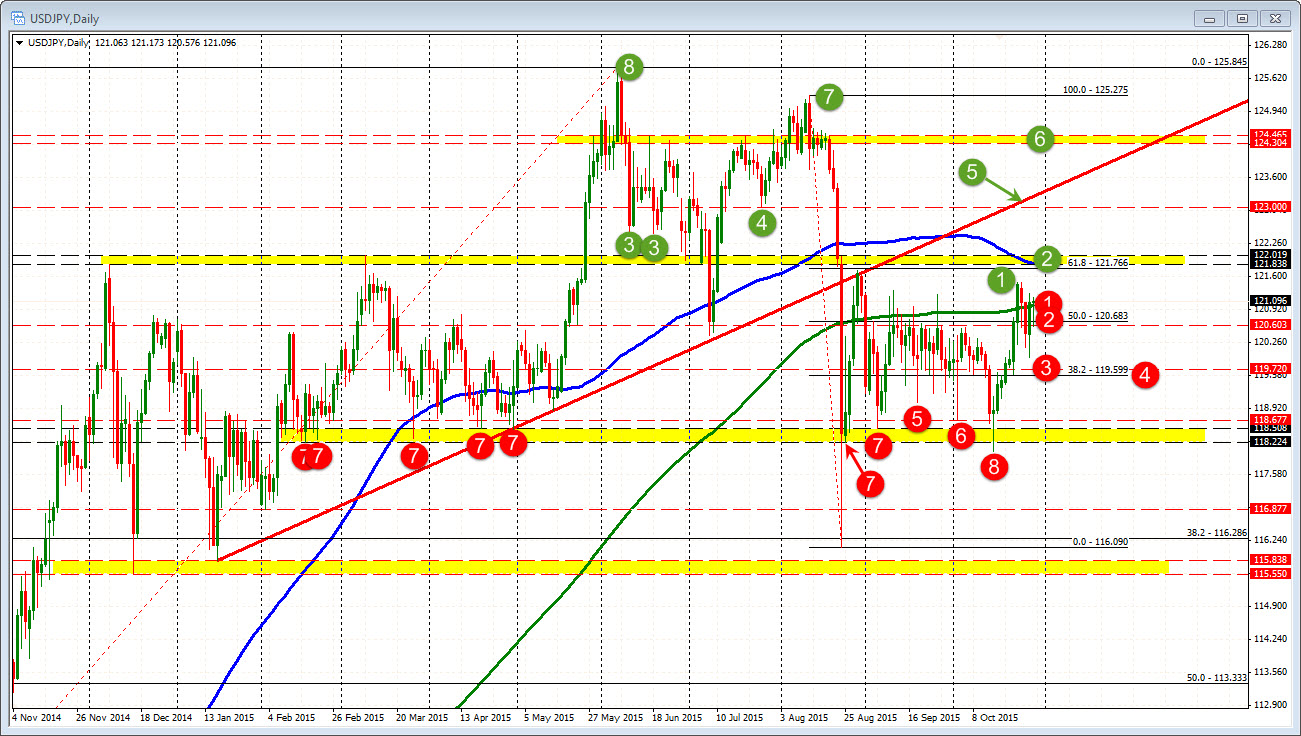
Bullish scenario (Green circles outline the technical levels explained below): If the BOJ announces more stimulus, with the Fed tightening (perhaps), the BOJ easing, it is the recipe for a higher USDJPY. Technically, the following levels will provide the roadmap. Traders can use the targets to define risk on a break or use to lean against for profit taking (or countertrend trades) if the news and price action supports the view.
- 121.48: This is the high price going back to October 26th. There should not be a problem getting and staying above this level.
- 121.76-122.02: This area incorporates highs from Dec 2014 (at 1.2183), March 2015 (at 122.02). In May the price broke and ran higher only to correct down to this level at the end of June (121.92) and beginning of July (121.86). In August the price fell to and through on the plunge from the Dow down 1000 day. The correction came up to 121.73 - just short of the area. The 100 dayMA is currently at 121.86. The 61.8% of the move down from the August high comes in at 121.766. This is the "real deal" area. A move above this level should stay above this area. There should be room to roam.
- 122.44-46: The next target comes in a the old double bottom at the 122.44 and 46 from June 10 and June 18. The level is not that important, but it was a level of importance at the time and traders like to remember those levels
- 123.00: The low price from July 27.
- 123.17: The underside of the broken trend line.
- 123.30-46: Swing highs from June/July
- 125.27: High from August.
- 125.845: High for the year (from June).
Bearish scenario (see Red circles in chart above): IF the BOJ disappoints (i.e. does not announce any change, is less dovish on the future), the downside should be explored but be aware of some clues a bottom might be forming. The idea is that the Fed will be tightening and the BOJ will eventually have to give in to more stimulus.
- 121.00: This is the 200 day MA. The current price is for the most part trading at this level but the MA remains an important line in the sand for traders
- 120.68: This is the 50% midpoint of the move down from the August high to the August low
- 119.72: A favorite of mine. In August (and until October 14), the USDJPY's lowest close was at 119.72. 50% of the trading range for October comes in at 119.76
- 119.59: Broken 38.2% retracement level and low from Oct 22
- 119.047: Swing low from Sept 18th.
- 118.67: Swing low from Oct 2
- 118.22-50: Colllection of swing lows from February , March, April and September
- 118.05. Low from October 15
With the consensus split, risk is elevated. However, if there is an ease or if the comments are not as dovish as perhaps the market is expecting there could be some opportunity. Given the USD side of the equation and the potential for a tightening Fed, the downside might be limited. Keep an eye out for support buyers in the 119.59-72 area ON the topside a move above the 122.00 area should make that area a pretty good line in the sand. I would expect traders to defend that area pretty strongly.
--------------------------------
Be sure to share, tweet if you like....

