100 and 200 hour MA at 112.73
Yesterday it was the look of a head and shoulders formation. The neckline was broken. The price moved lower. It stalled at the 61.8% of the move up from the low. It does not look so head and shoulder-y anymore.

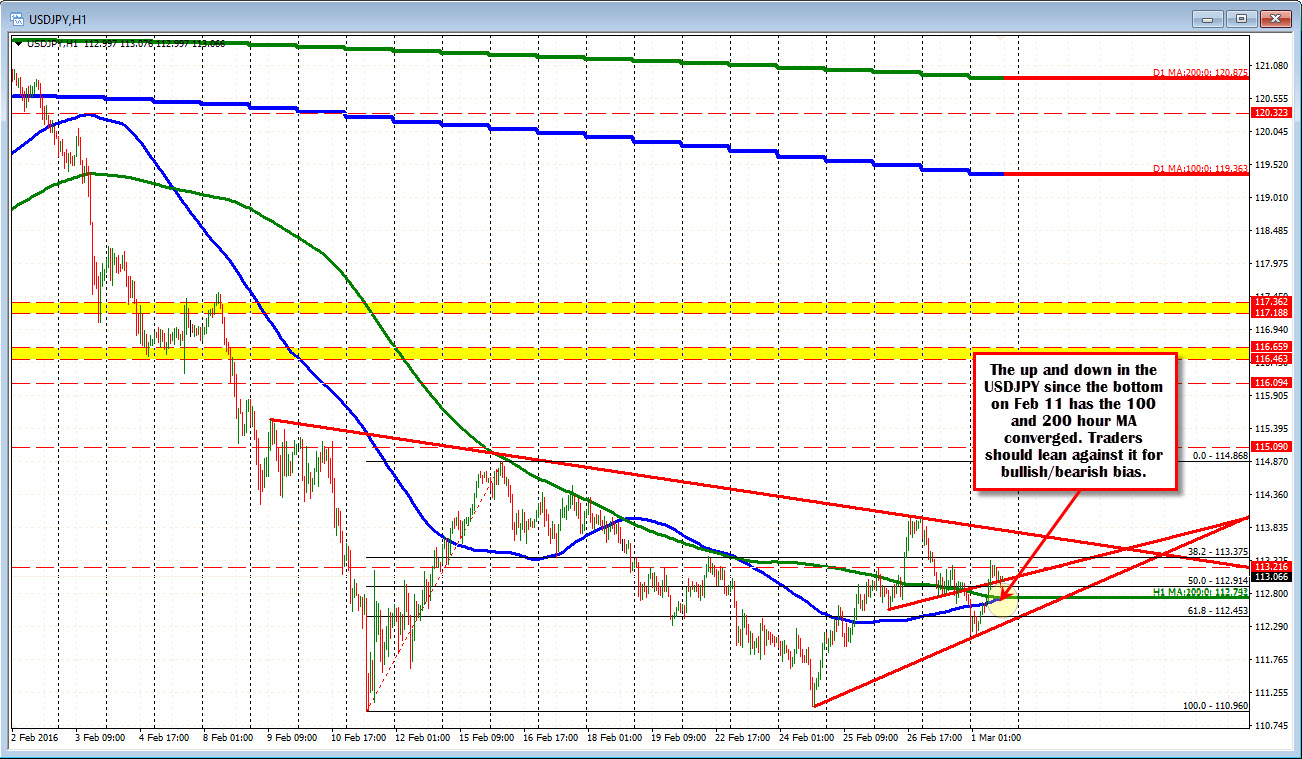
Today, the 100 and 200 hour MA are converged at the 112.739 level. Looking at the hourly chart, the pair based against those moving averages and move higher. Over the last 6 hours, the pair has rotated back down. The two moving averages should provide a risk defining level intraday - stay above more bullish move below more bearish. That is my best risk defining level.
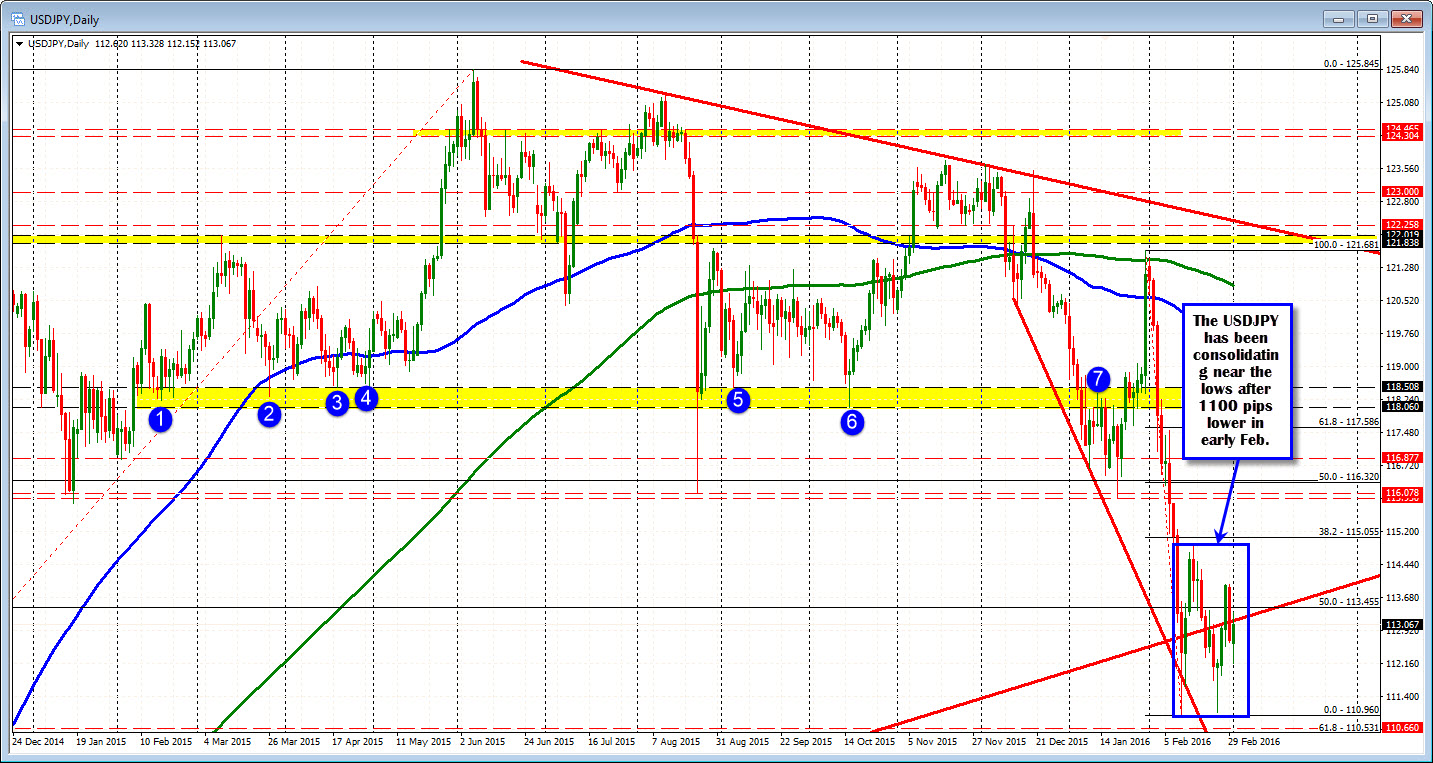
Looking at the daily chart, the price for the pair has been choppy higher and lower. This comes after a 1100 pip move down in less than 2-weeks in the beginning of February. So putting things into perspective, the pair is consolidating. That consolidation phase may continue. So be on the lookout at extremes.
Currently however, we sit near the middle of that consolidation. The 112.91 is the midpoint of the range since the bottom on February 11. The price is trading right around that level.

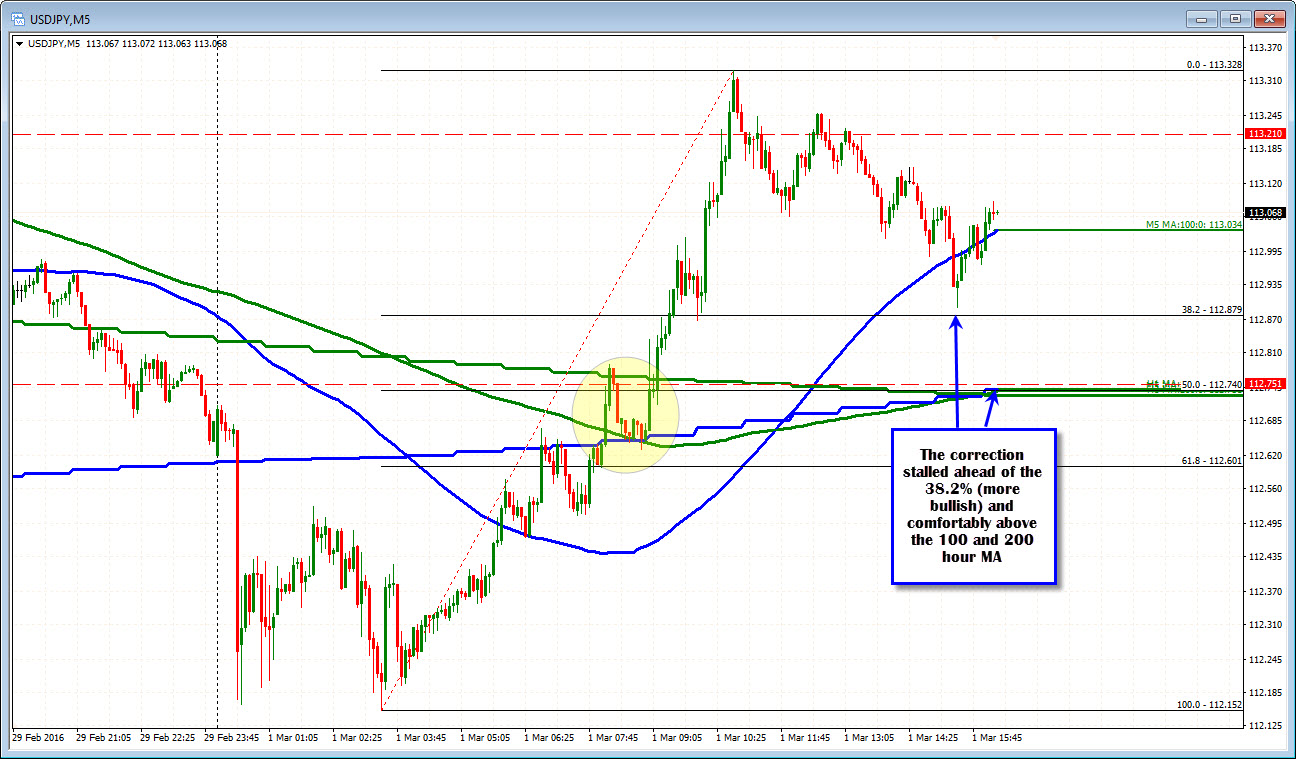
Might as well drill down to the 5-minute chart too. You can see the action near the overlay of the 100 and 200 hour MA (the step blue and green lines in the chart below). The las corrective move down in the early NY session, came to the 38.2% of the days range and remains comfortably above the 100 and 200 hour MA. So the buyers are looking to keep control.


