
Range can be defined by about 100 pips now
The USDJPY has been consolidating since January 6. Range most of the trading since that time has been between 117.18 and 118.81. More recently the topside has been defined by the 200 hour moving average (green line in the chart below). That moving average currently comes in at 118.169. The level also corresponds with the 38.2% retracement of the trend move down from the December 30 high to the January 8 a low.
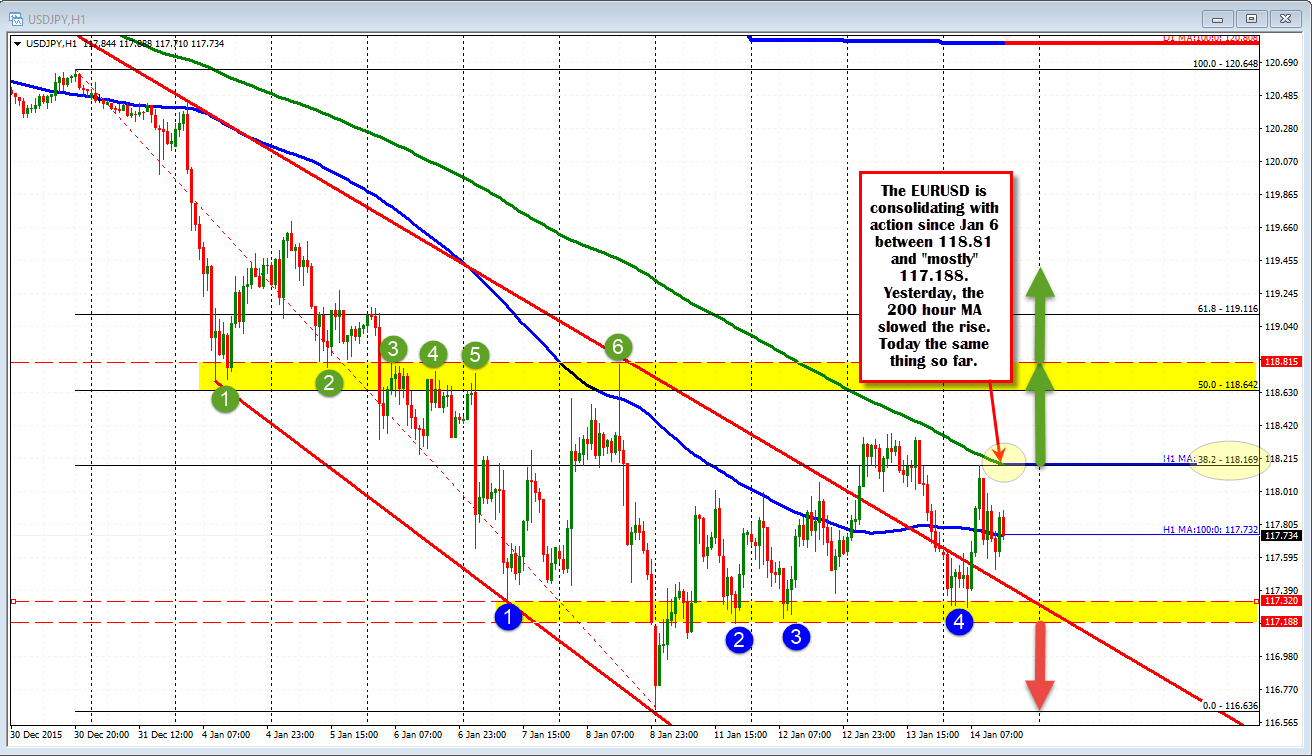
Today, the price is trading above and below the 100 hour MA (blue line in the chart above). That comes in at 117.73 currently. That moving average splits the difference between the support below at 117.18-32 and the resistance above against the 200 hour MA today.
Looking at the daily chart, the pair has moved below a floor area at the 118.22-50 area. There were a number of lows in this area going back to Feb 2015. Stay below and the nod remains with the bears. The high yesterday moved into the yellow area. Today the high fell just short. ON the downside 116.09 and then 115.55-83 would be targets. The
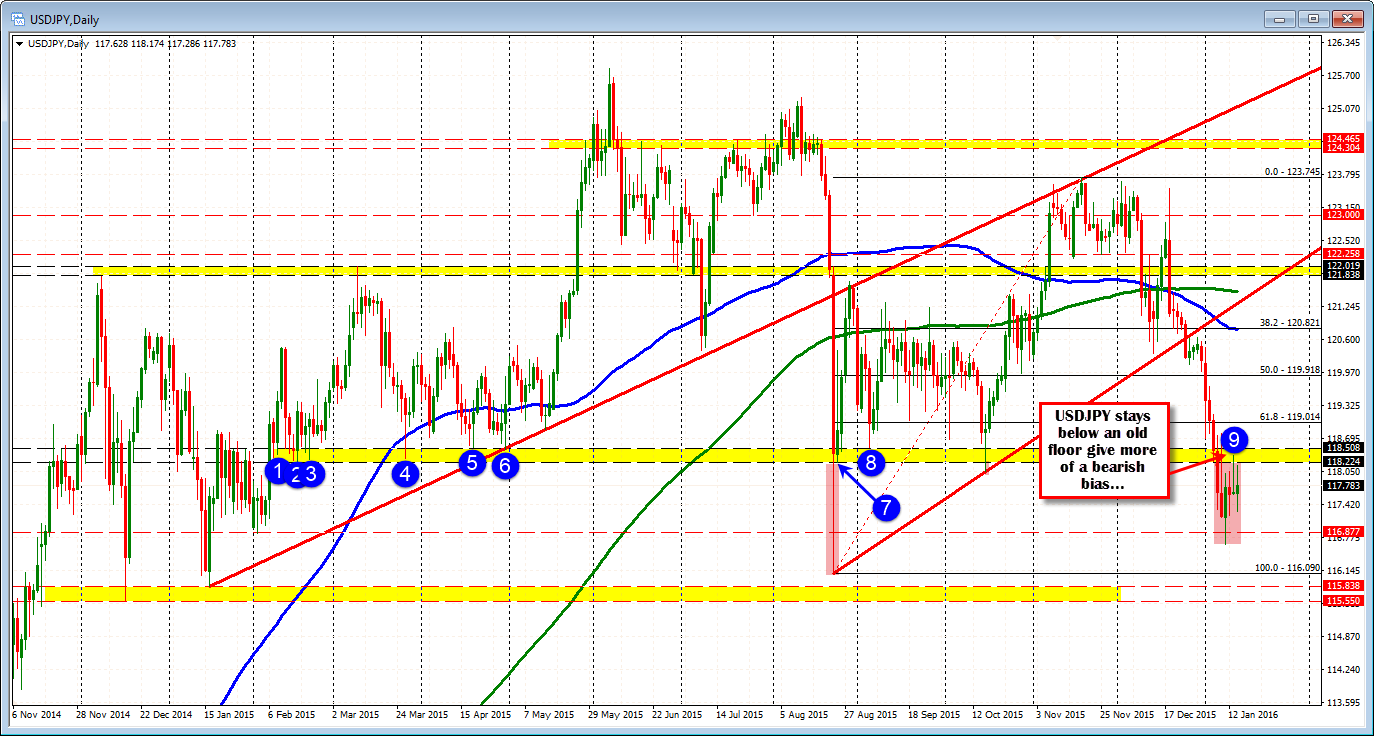
Market traders seem to be waiting at these levels and with the stock market volatility, but the control remains with the sellers.

