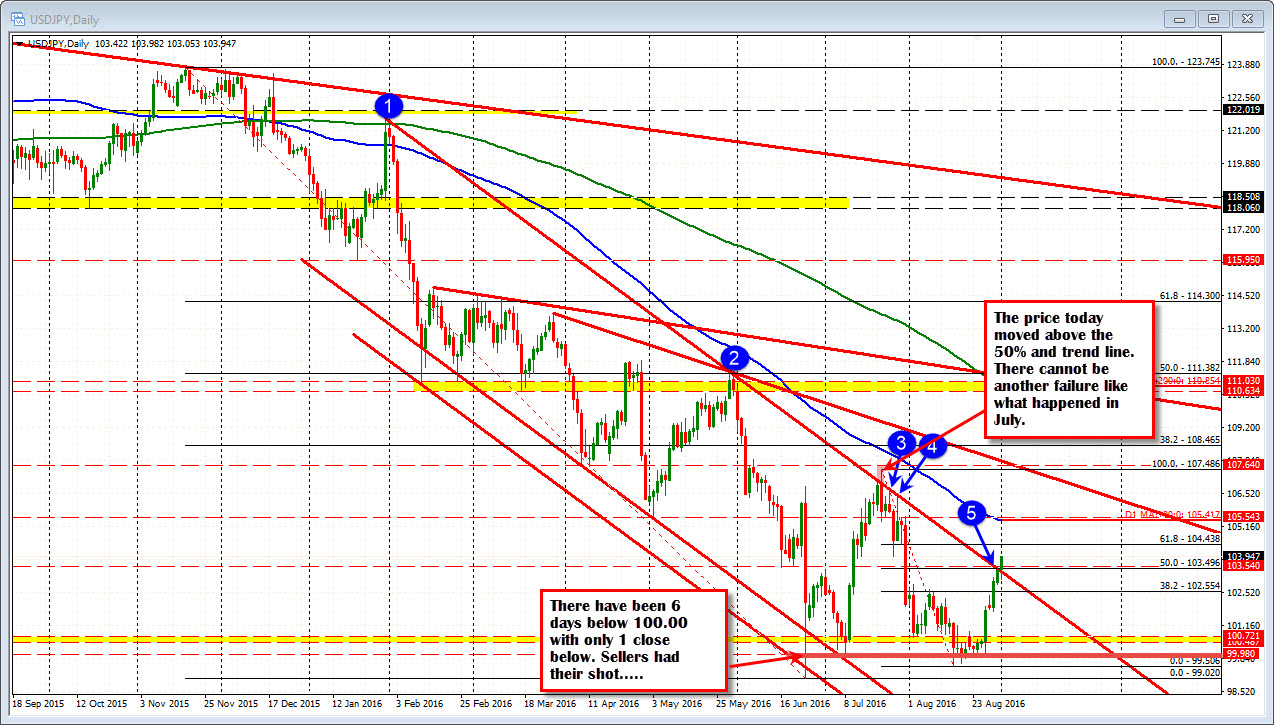
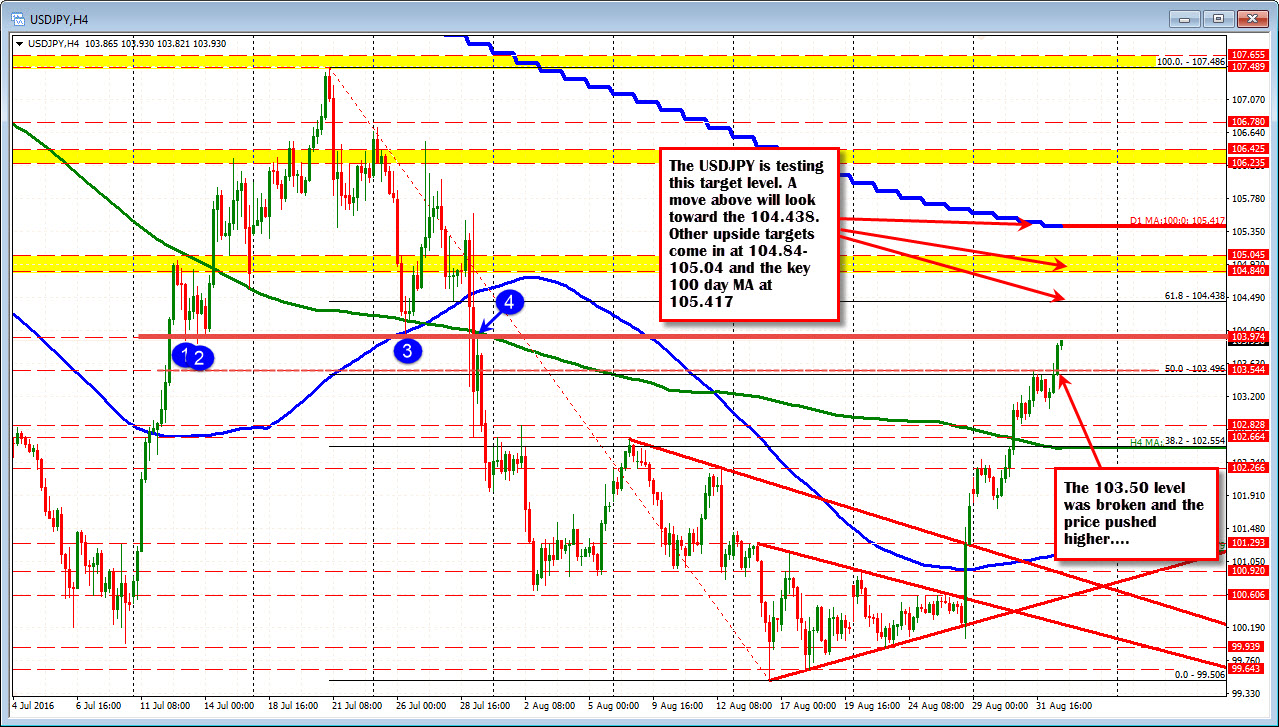
Moves above a key resistance area
Yesterday, the USDJPY traded up to the 50% retracement area at the 103.50 area, and stalled. Today the price has moved above that level and has marched up to the next target area defined by the swing lows from July 13 and July 26. Those levels come in at 103.89 and 103.98 respectively. The high for the day comes in at 103.866 so far. Other targets above come in at 104.438 (61.8% of the move down from the July high), the 104.84-105.04 and the key 100 day MA at 105.417. The USDJPY price has not traded above the 100 day MA since Feb 2, 2016.
Looking at the daily chart, the break higher today also took the price above a trend line connecting a number of highs (see red circles). There was a break above that line in July, but that was quickly reversed. ON the break today, traders do not want to see a reversal and move back below the broken trend line going forward. That would be a 2nd failure and be indicative of buyers not being too strong.
For the time being though, there is addition room to roam on the upside. The pair has been hit hard in 2016 (high was 121.68). The 100.00 (parity level) was tested hard with moves below the level in June (quickly reversed). In July the price moved to 99.98 (so pretty much held the level) and in August there were 4 days the traded below with one close below the level. Seller had their shots.